Fig. 8
Download original image
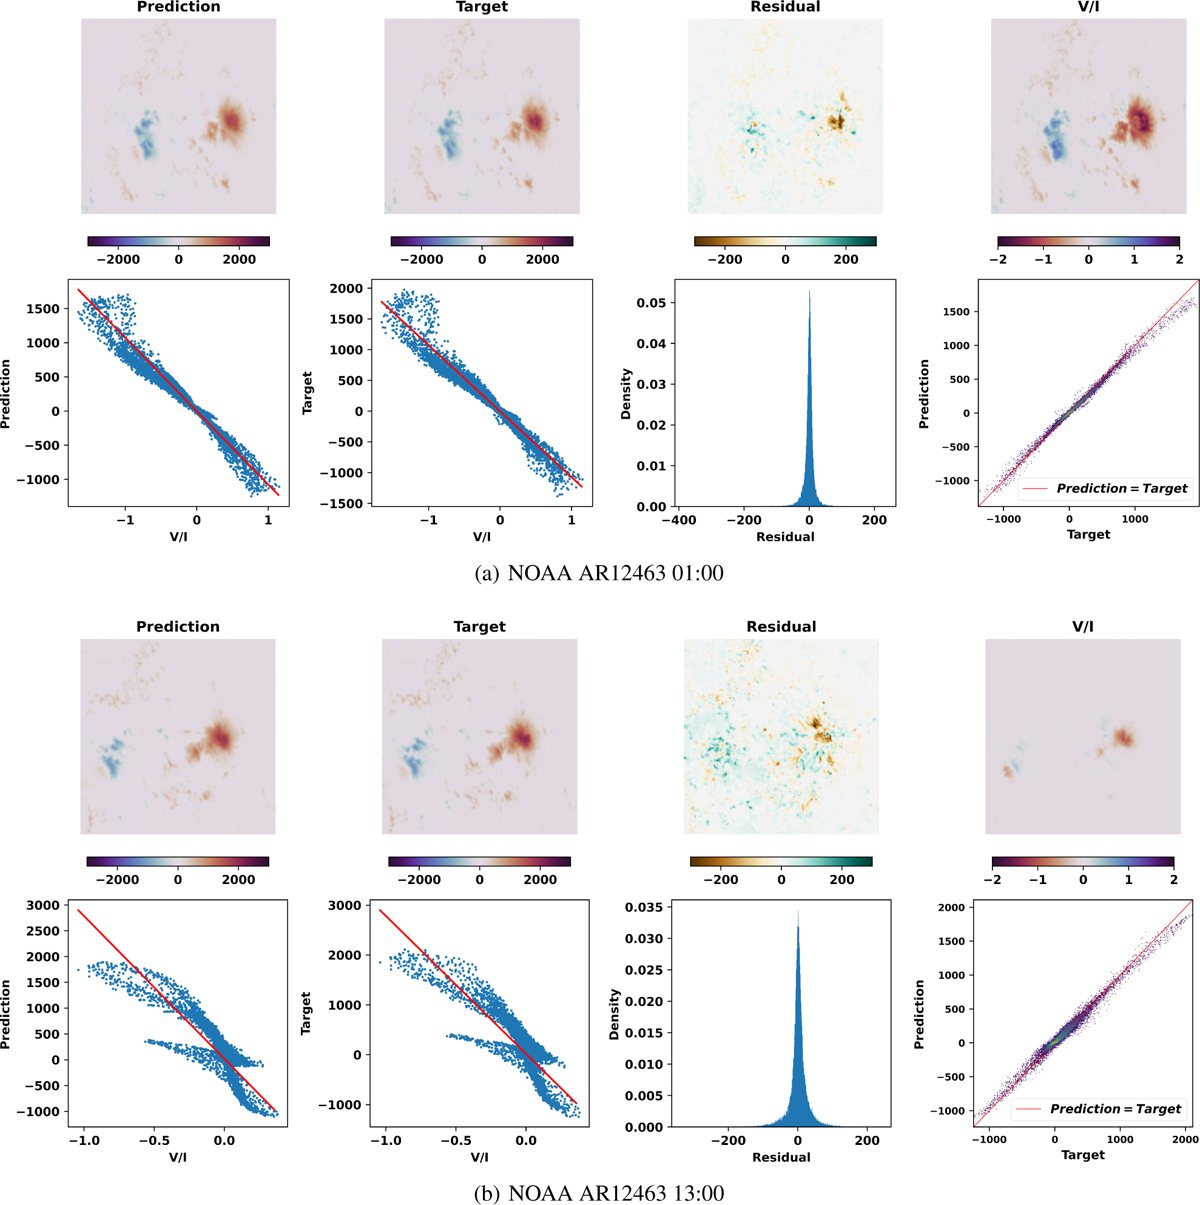
Longitudinal magnetic field of NOAA AR12463. (a) Result at 01:00, OBSVR is 1738.65 m s−1; (b) is at 133:00, OBSVR is −2208.77 m s−1. The first row of sub-images of (a) and (b) are the prediction of NOAA AR12463; the inverted image as the target; the residual error between the prediction and the target; the circular polarization signal Stokes V related to the longitudinal magnetic field. The first two pictures in the second row of subpicturec aire scatter plots of V and the longitudinal field. The horizontal axis; is V, and the vertical axis is the longitudinal field. The vertical axis of the left first picture in the row two is the prediction of the neural network, and the vertical axis of the second picture is the target. The third picrure in trie second row is a statistical histogram of errors, and the unit of the horizontal axis is G. The fourth picture is a scatter histogram of prediction and target. The horizontal axis is target and the verticai axis is prediction, and both units are G.
Current usage metrics show cumulative count of Article Views (full-text article views including HTML views, PDF and ePub downloads, according to the available data) and Abstracts Views on Vision4Press platform.
Data correspond to usage on the plateform after 2015. The current usage metrics is available 48-96 hours after online publication and is updated daily on week days.
Initial download of the metrics may take a while.