Fig. 5
Download original image
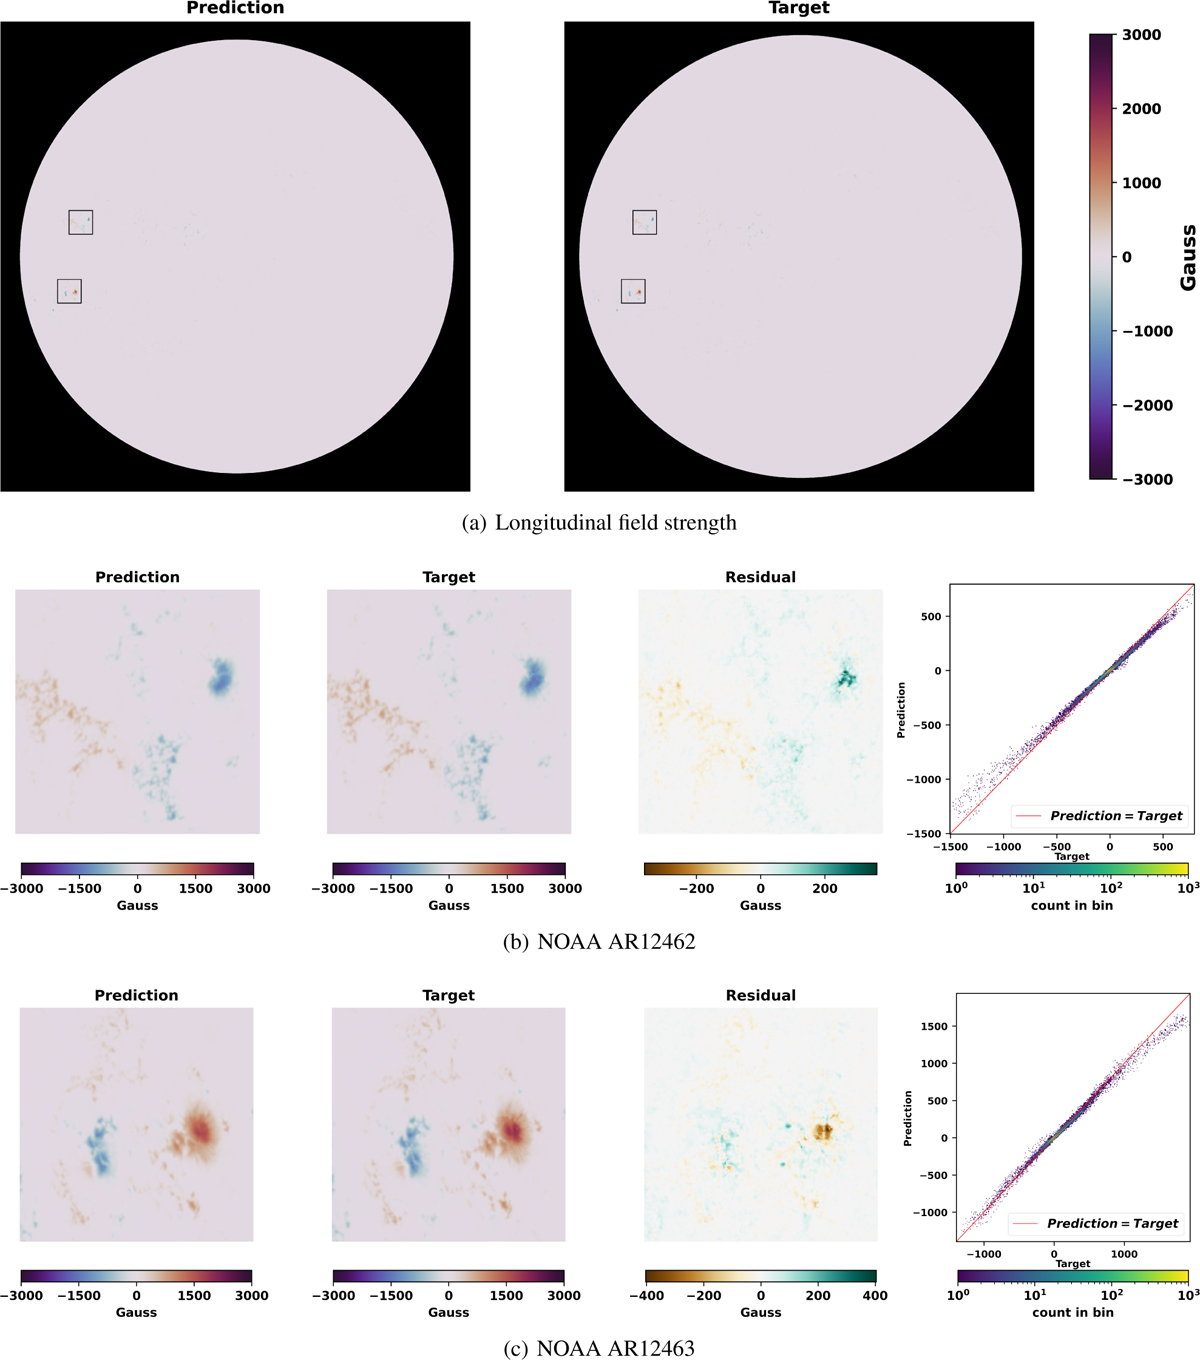
Result of the longitudinal field. (a) Full disk: longitudinal magnetogram at 00:00:00 on December 6, 2015, both images are 4096 × 4096 pixels. Left: prediction from neural network. Right: inversion result from VFISV. Two activity regions are marked with black boxes. (b)Active region NOAA AR12462 in (a). From left to right: prediction of the neural network; inversion result from VFISV; Residual of the prediction and inversion; Scatter diagram, the horizontal axis is the target, and the vertical axis is the prediction. (c) The active region NOAA AR12463 in (a). Same as (b).–
Current usage metrics show cumulative count of Article Views (full-text article views including HTML views, PDF and ePub downloads, according to the available data) and Abstracts Views on Vision4Press platform.
Data correspond to usage on the plateform after 2015. The current usage metrics is available 48-96 hours after online publication and is updated daily on week days.
Initial download of the metrics may take a while.