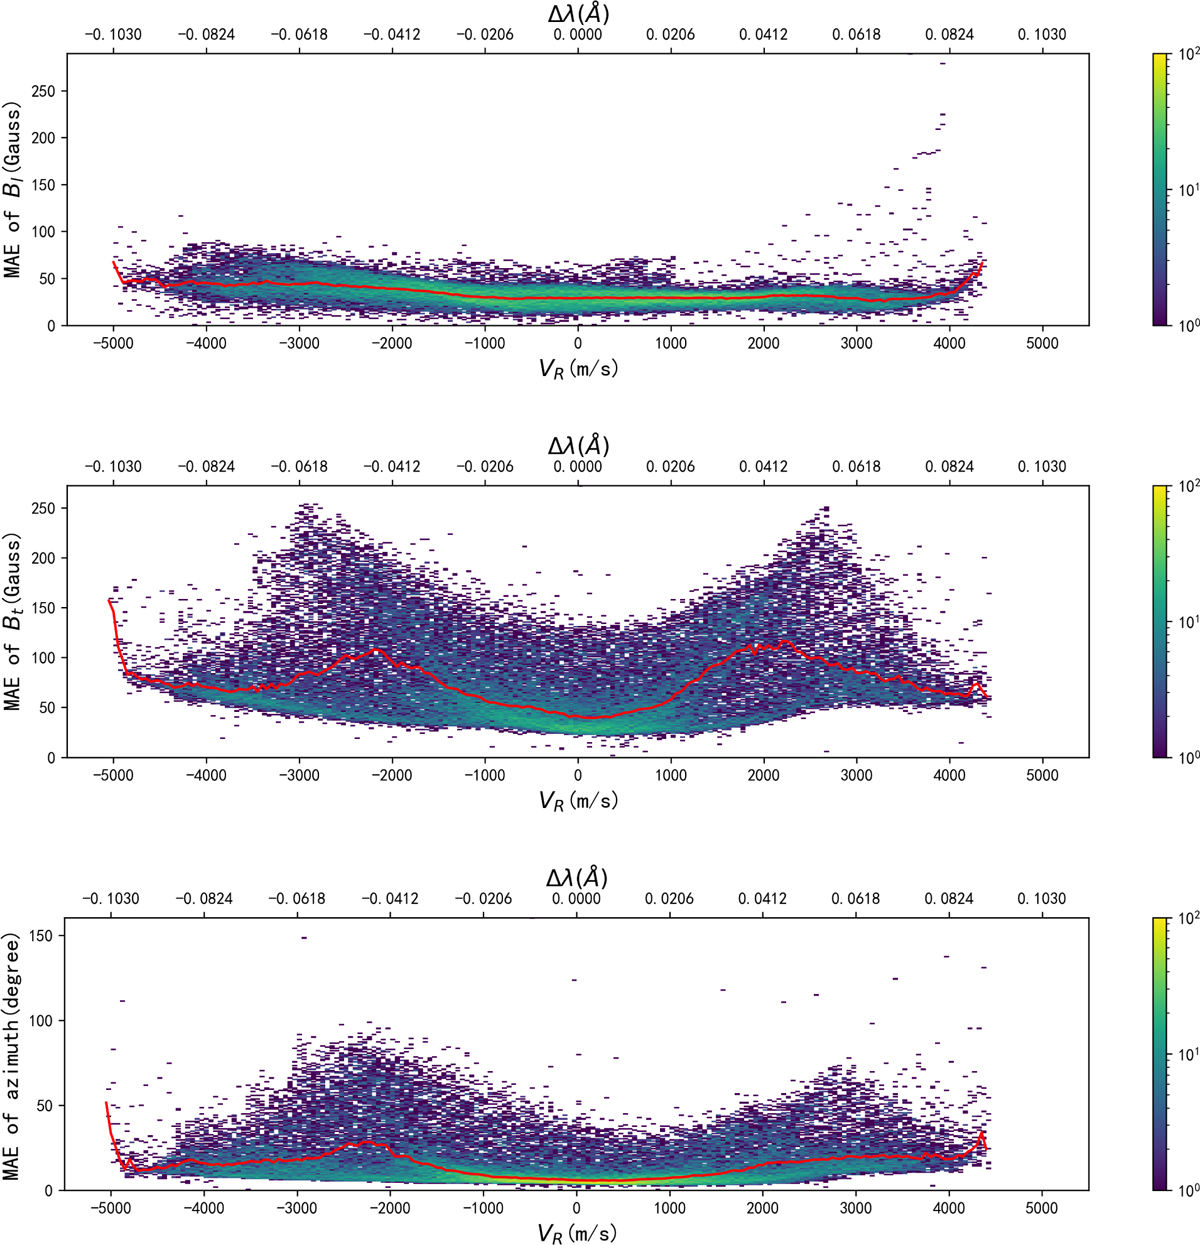
Fig. 12
Download original image
2D histogram of MAE error and relative motion VR in the test set. Red line is the median MAE at different relative velocities. From top to bottom: MAEerrors of the longitudinal magnetic field, the transverse magnetic field, and the azimuth angle. The horizontal axis at the top of each graph indicates the wavelength shift Δλ corresponding to the relative velocity. Color bars show the bin counts.
Current usage metrics show cumulative count of Article Views (full-text article views including HTML views, PDF and ePub downloads, according to the available data) and Abstracts Views on Vision4Press platform.
Data correspond to usage on the plateform after 2015. The current usage metrics is available 48-96 hours after online publication and is updated daily on week days.
Initial download of the metrics may take a while.