Open Access
Fig. 10
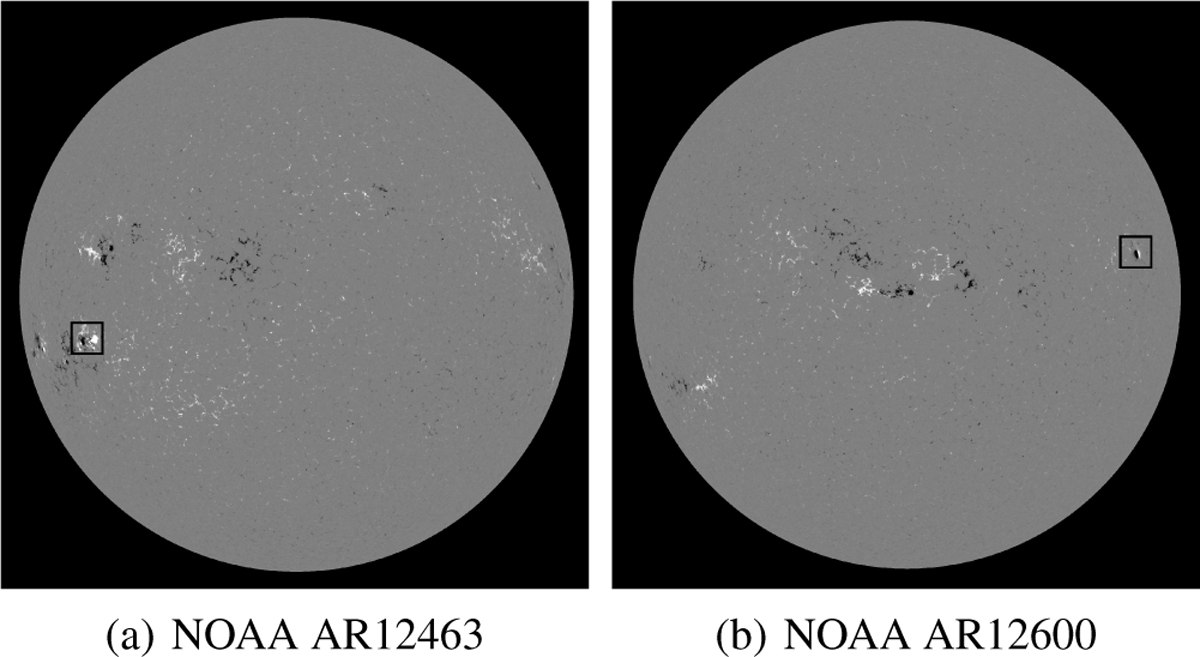
Download original image
Position of the active area on the sun surface. (a) The LoS magnetic map at 00:00 ont December 6, 22015, where the framed part is NOAA AR12463. (b) The LoS magnetic map at 00:00 on October 17, 2016, where the framed part is NNOAA AR12600.
Current usage metrics show cumulative count of Article Views (full-text article views including HTML views, PDF and ePub downloads, according to the available data) and Abstracts Views on Vision4Press platform.
Data correspond to usage on the plateform after 2015. The current usage metrics is available 48-96 hours after online publication and is updated daily on week days.
Initial download of the metrics may take a while.