Fig. 1
Download original image
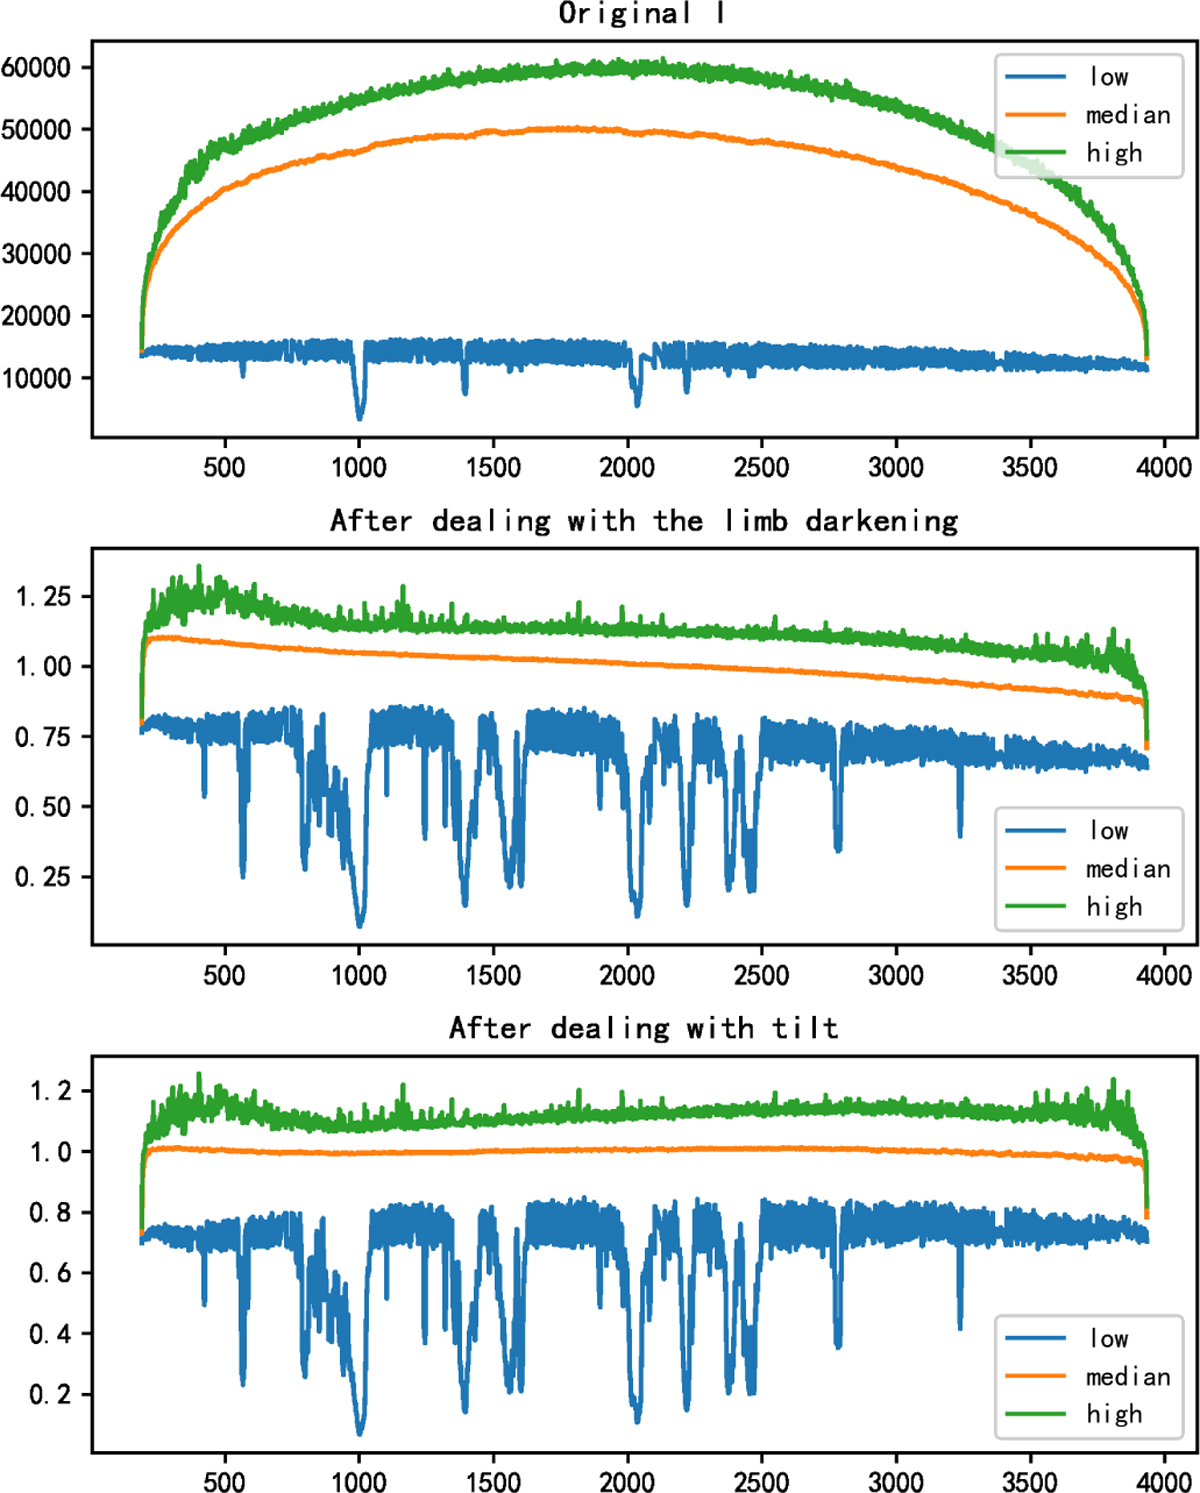
Preprocessing: Three sub-images are features of the I image at three different stages in the preprocessing, i.e., the original data, the data with limb darkening corrected, and the data with tilt corrected. The three curves in each picture represent: the minimum (blue curve labeled by low in the figure), median (orange curve labeled by median in the figure), and maximum (green curve labeled by high in the figure) values of each column in the image, respectively. The horizontal axis represents the column of the image, and the unit is pixel. 0 is east of the sun, 4096 is west of the sun. The vertical axis is the value of each pixel.
Current usage metrics show cumulative count of Article Views (full-text article views including HTML views, PDF and ePub downloads, according to the available data) and Abstracts Views on Vision4Press platform.
Data correspond to usage on the plateform after 2015. The current usage metrics is available 48-96 hours after online publication and is updated daily on week days.
Initial download of the metrics may take a while.