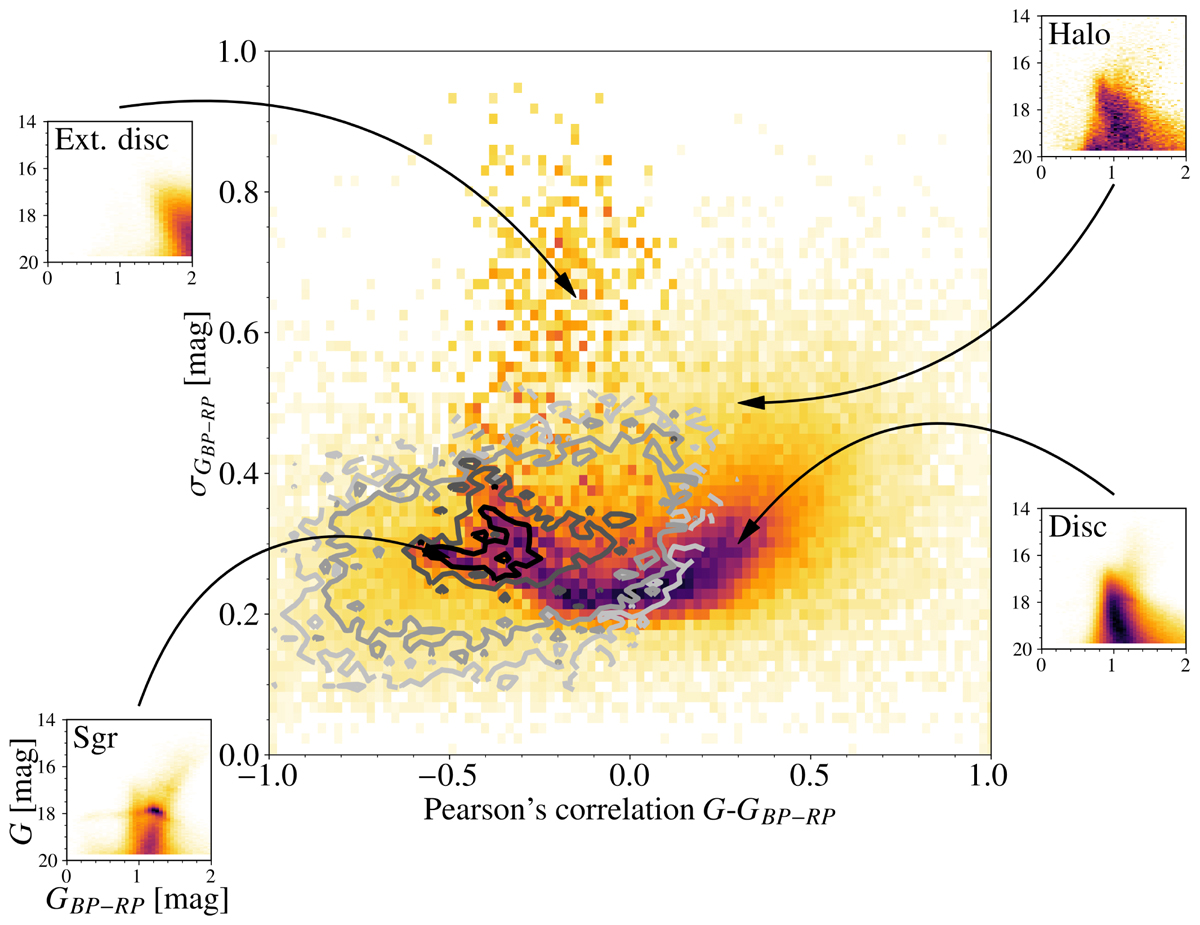
Fig. B.2.
Download original image
Result of the K-means clustering. Centre: Histogram in the space of rG − colour versus σGBP − RP weighted by the number of stars of the peaks that fulfil the filter of Table B.1. The contours correspond to the peaks labelled Sgr stream. Bottom left: Example of a CMD obtained from the peaks associated with Sgr. Bottom right: Same but peaks associated with the disc. Top right: Same but for the halo. Top left: Same but for the very extincted disc.
Current usage metrics show cumulative count of Article Views (full-text article views including HTML views, PDF and ePub downloads, according to the available data) and Abstracts Views on Vision4Press platform.
Data correspond to usage on the plateform after 2015. The current usage metrics is available 48-96 hours after online publication and is updated daily on week days.
Initial download of the metrics may take a while.