Open Access
Fig. B.1.
Download original image
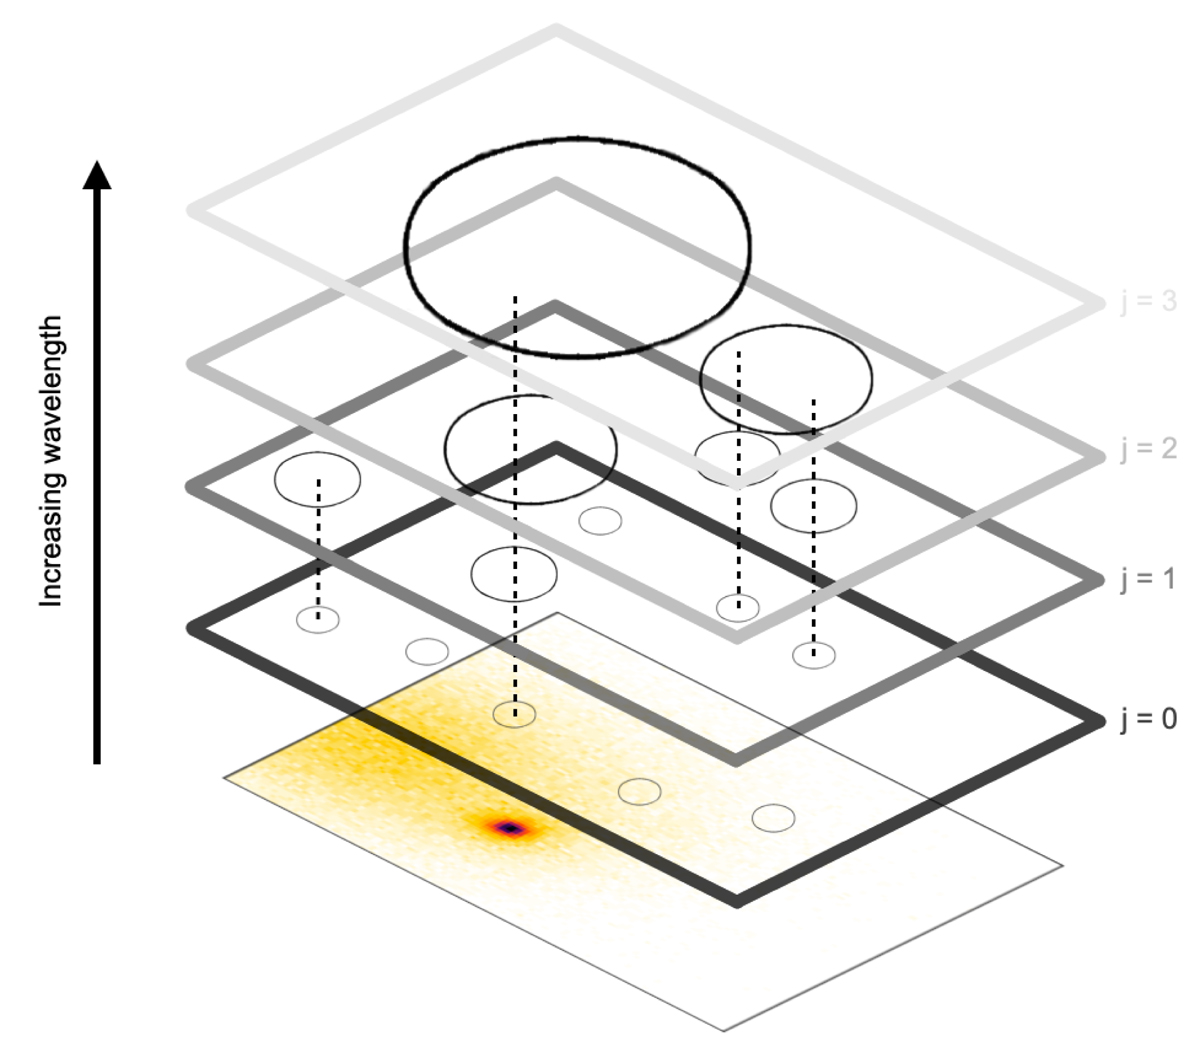
Schematic representation of the WT and the kinematic trees. From a proper motion histogram (bottommost plane), a series of layers (numbered as in Eq. B.1) are extracted, each with a number of peaks. These peaks may be caused by the same structure and can be linked into isolated kinematic trees (see text).
Current usage metrics show cumulative count of Article Views (full-text article views including HTML views, PDF and ePub downloads, according to the available data) and Abstracts Views on Vision4Press platform.
Data correspond to usage on the plateform after 2015. The current usage metrics is available 48-96 hours after online publication and is updated daily on week days.
Initial download of the metrics may take a while.