Fig. 7.
Download original image
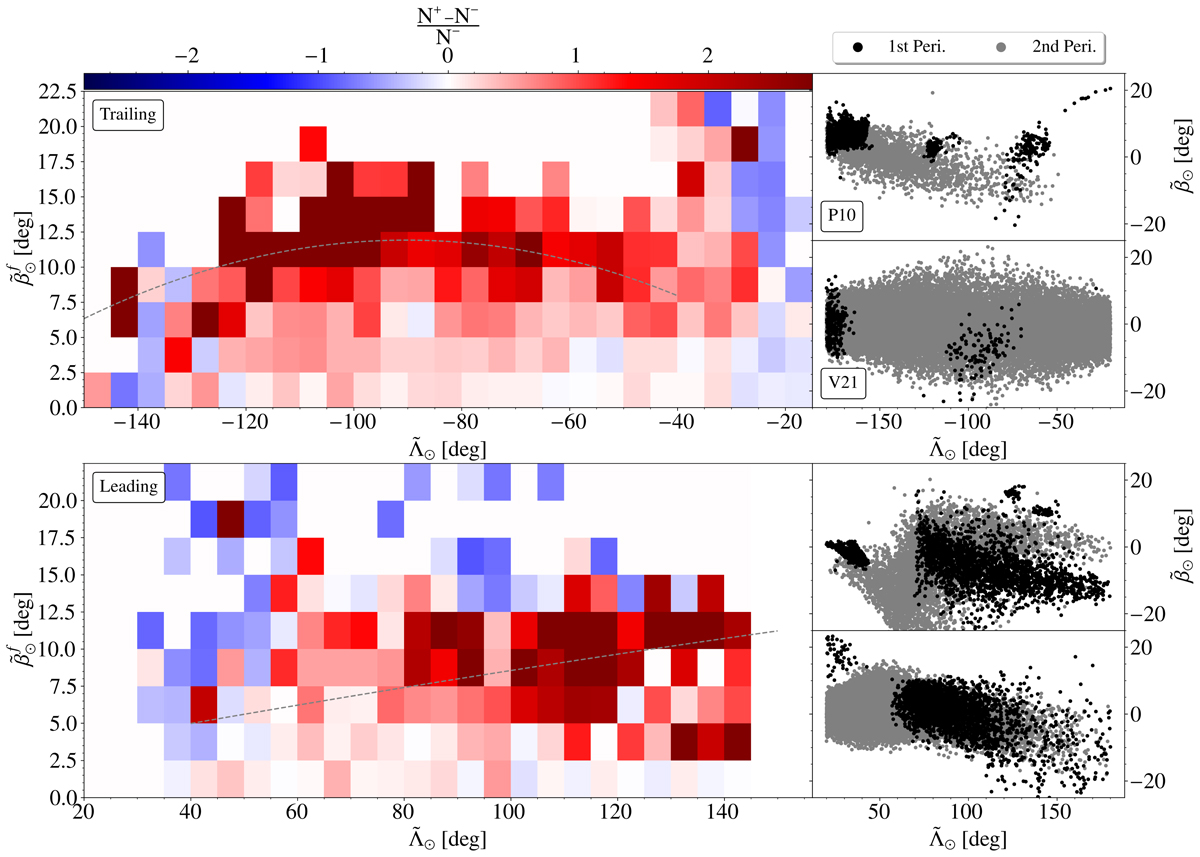
Normalised difference in counts between the two halves of the stream, folded in ![]() along the line of highest density. The upper script of
along the line of highest density. The upper script of ![]() stands for ‘folded’. The grey dash lines correspond to the difference between the polynomials of the faint and bright branches (Table 1). On the right, we include
stands for ‘folded’. The grey dash lines correspond to the difference between the polynomials of the faint and bright branches (Table 1). On the right, we include ![]() versus
versus ![]() scatter plots of the stellar particles in the V21 and P10 N-body models, after applying a similar kinematic filter to the one used for the data, and separating by the time of stripping (black for the first pericentre, grey for the second). The bifurcation in the Sgr stream is obvious in the data and coincides with the functional form fitted in Sect. 2.2. Also, the P10 model presents a clear bimodality, qualitatively similar to the data, produced by the first pericentre material.
scatter plots of the stellar particles in the V21 and P10 N-body models, after applying a similar kinematic filter to the one used for the data, and separating by the time of stripping (black for the first pericentre, grey for the second). The bifurcation in the Sgr stream is obvious in the data and coincides with the functional form fitted in Sect. 2.2. Also, the P10 model presents a clear bimodality, qualitatively similar to the data, produced by the first pericentre material.
Current usage metrics show cumulative count of Article Views (full-text article views including HTML views, PDF and ePub downloads, according to the available data) and Abstracts Views on Vision4Press platform.
Data correspond to usage on the plateform after 2015. The current usage metrics is available 48-96 hours after online publication and is updated daily on week days.
Initial download of the metrics may take a while.