Fig. 6.
Download original image
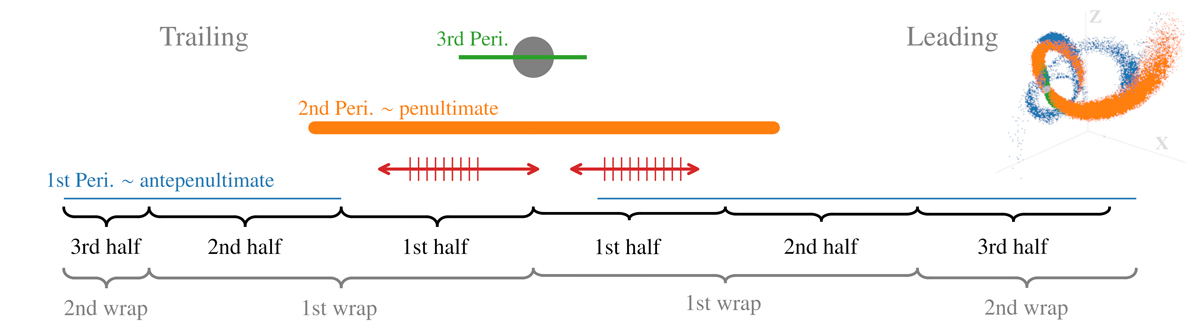
Schematic representation of the stream based on the V21 model. The lines represent the ![]() extent of the material ejected during each perigalacticon, while their width is proportional to the amount of particles they contain. The blue line is for the stellar particles stripped near the first pericentre, the orange for the second one, and the green for the most recent pericentre passage. We also include the nomenclature of the wraps and the halves into which we divide the stream. As can be seen, the leading arm has stretched more than the trailing, probably due to the shorter dynamical timescale. The 3D distribution in galactocentric coordinates of the stellar particles is shown in the top right inset. Finally, the red arrows represent the range of our data (see Fig. 1), and the hatched portion is where we detect the faint branches of the bifurcation.
extent of the material ejected during each perigalacticon, while their width is proportional to the amount of particles they contain. The blue line is for the stellar particles stripped near the first pericentre, the orange for the second one, and the green for the most recent pericentre passage. We also include the nomenclature of the wraps and the halves into which we divide the stream. As can be seen, the leading arm has stretched more than the trailing, probably due to the shorter dynamical timescale. The 3D distribution in galactocentric coordinates of the stellar particles is shown in the top right inset. Finally, the red arrows represent the range of our data (see Fig. 1), and the hatched portion is where we detect the faint branches of the bifurcation.
Current usage metrics show cumulative count of Article Views (full-text article views including HTML views, PDF and ePub downloads, according to the available data) and Abstracts Views on Vision4Press platform.
Data correspond to usage on the plateform after 2015. The current usage metrics is available 48-96 hours after online publication and is updated daily on week days.
Initial download of the metrics may take a while.