Fig. 5.
Download original image
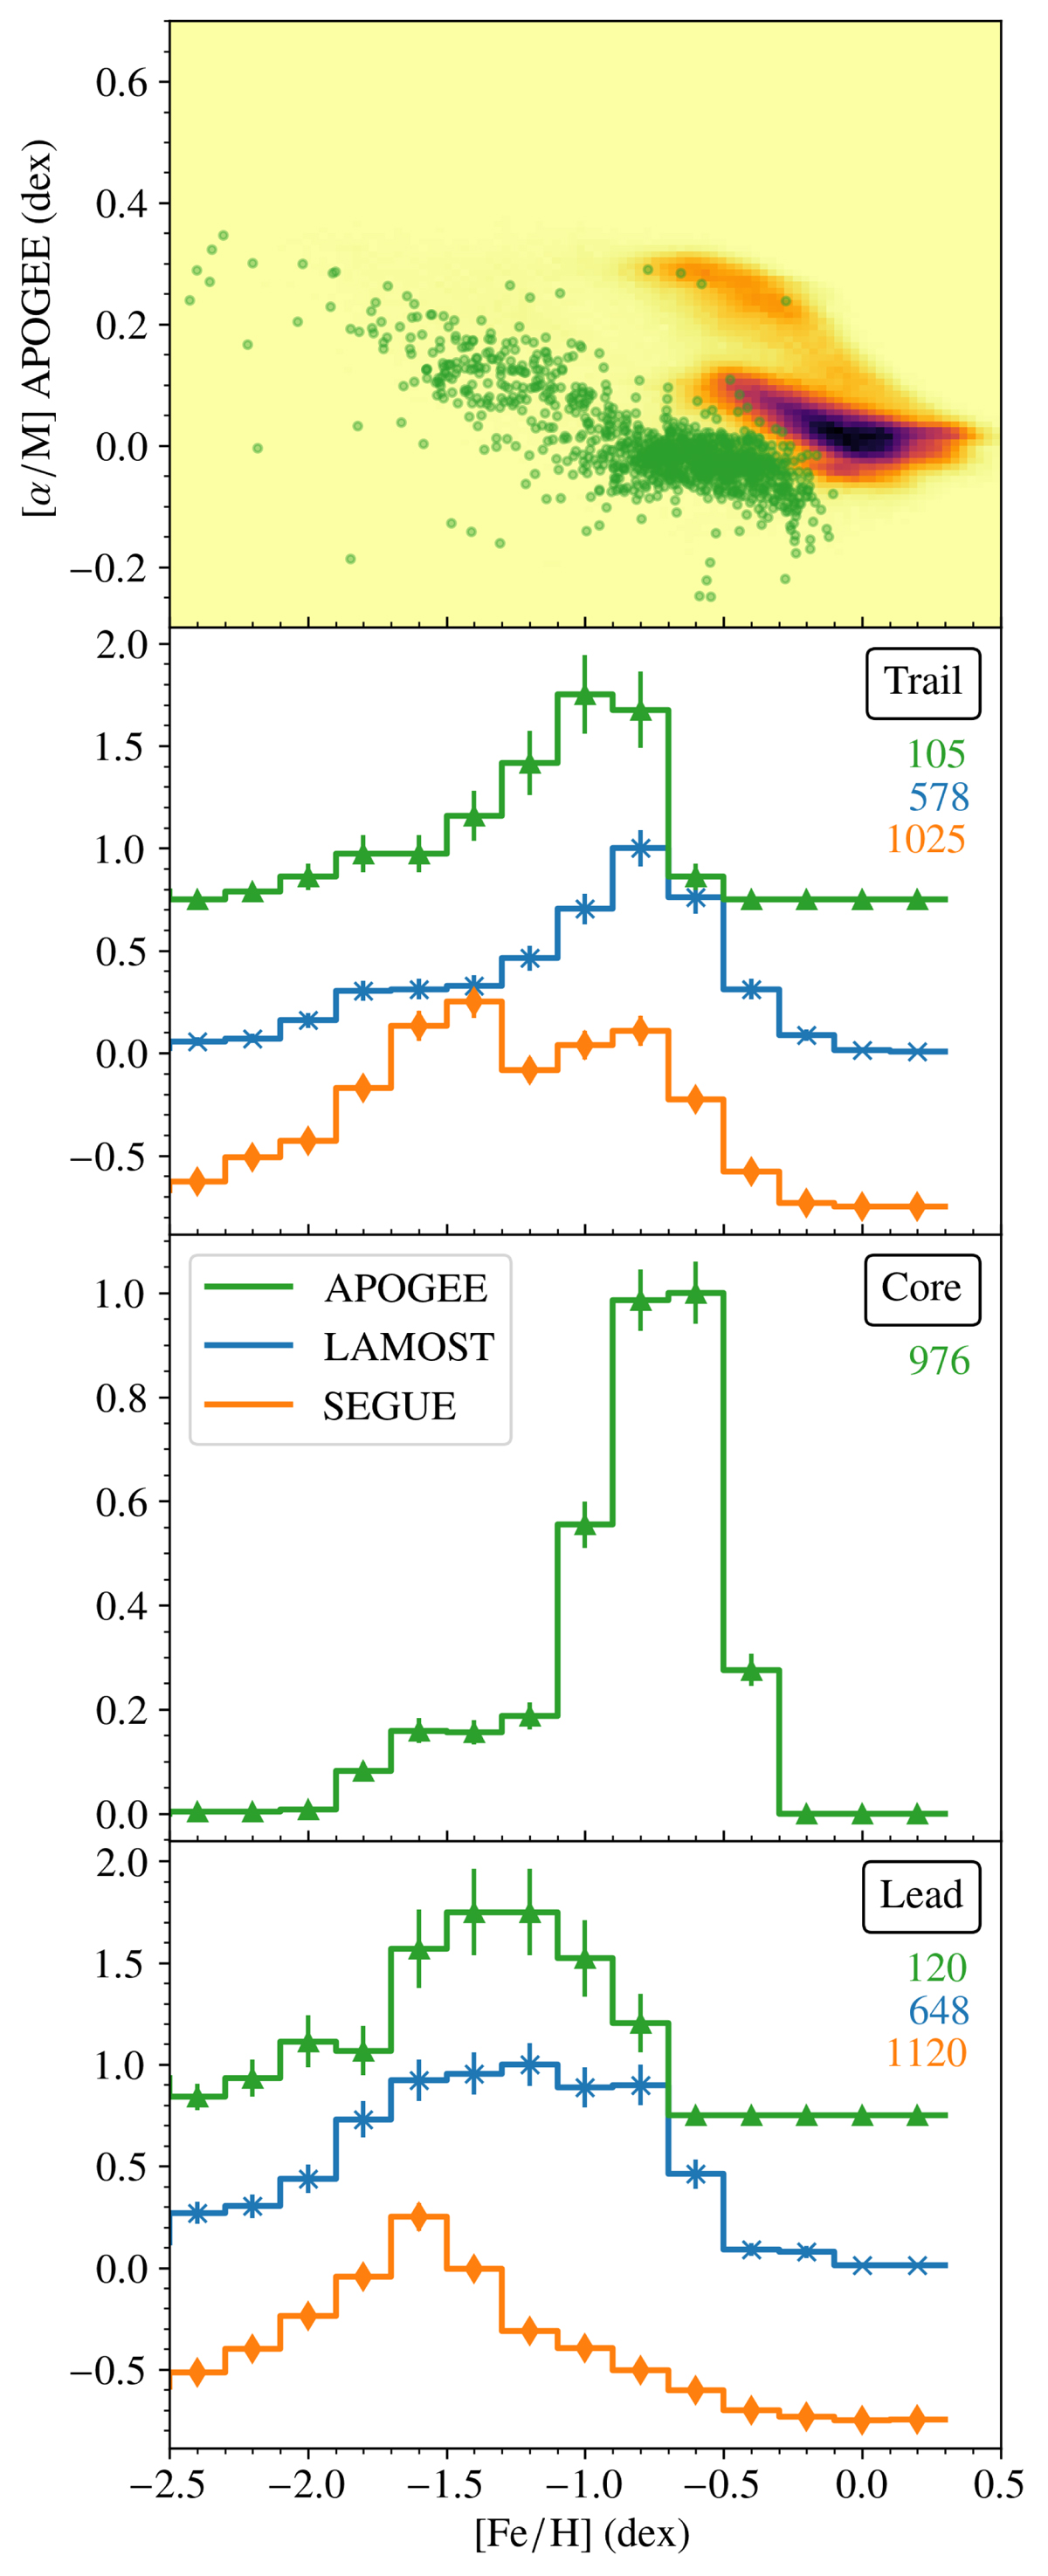
Chemical composition of the Sgr stream. Top panel: [α/M] against [Fe/H] of the stream with APOGEE data (in the background, the same but for the whole APOGEE sample). Bottom panel: Normalised metallicity distribution function for the trailing (![]() ), core (
), core (![]() ), and leading (
), and leading (![]() ) parts (top, middle, and bottom, respectively) in bins of 0.2 dex, shifted vertically for clarity. Top right part of each panel we show the number of stars. All three samples, LAMOST, APOGEE, and SEGUE, agree that the leading arm is more metal poor than the trailing.
) parts (top, middle, and bottom, respectively) in bins of 0.2 dex, shifted vertically for clarity. Top right part of each panel we show the number of stars. All three samples, LAMOST, APOGEE, and SEGUE, agree that the leading arm is more metal poor than the trailing.
Current usage metrics show cumulative count of Article Views (full-text article views including HTML views, PDF and ePub downloads, according to the available data) and Abstracts Views on Vision4Press platform.
Data correspond to usage on the plateform after 2015. The current usage metrics is available 48-96 hours after online publication and is updated daily on week days.
Initial download of the metrics may take a while.