Fig. 4.
Download original image
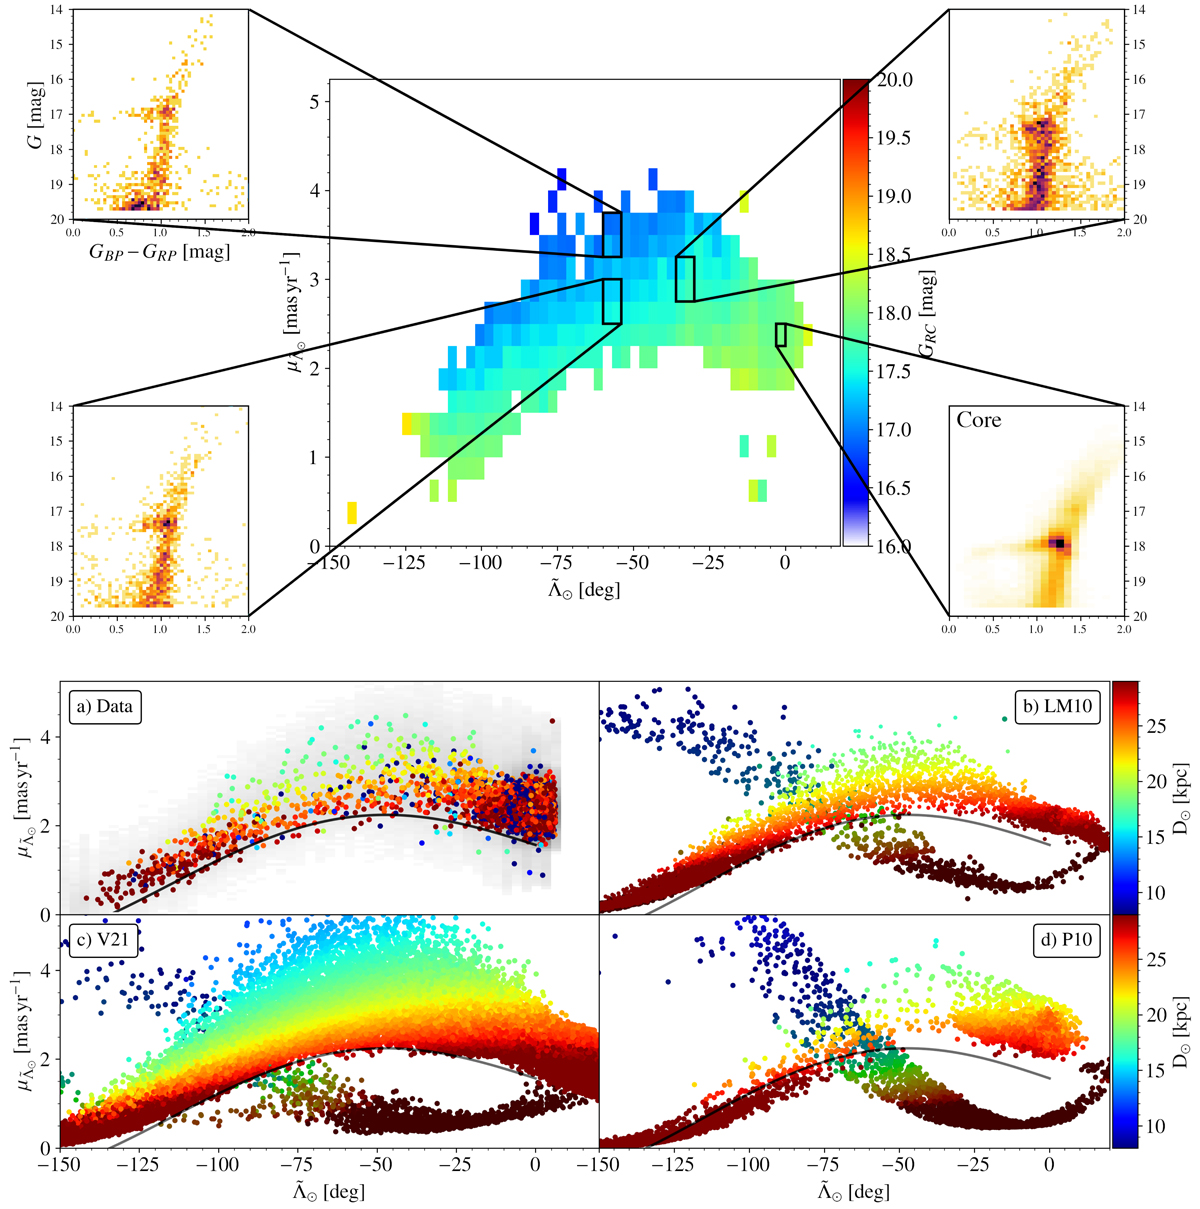
Tangential proper motion as a function of ![]() , coloured by different distance estimators, for the trailing arm. Top: coloured by the G magnitude of the red clump, as exemplified by the CMDs surrounding the panel (no extinction correction). Bottom: same projection, now coloured by distance, but for the RR Lyrae in our sample (a) as well as three different N-body simulations ((b) for LM10, (c) for V21, and (d) for P10). We note a clear correlation between the modulus of the proper motion vector and the distance, with small distances corresponding to larger proper motions. The data are, in general, well reproduced by the recently stripped material (light colours). The black lines correspond to the lower limit used in our selection of the peaks (see Table B.1). The V21 is the model that best represents the data. In darker colours, we show the second wrap of the leading arm, and we note that each model predicts a different distribution and region of overlap with the trailing tail.
, coloured by different distance estimators, for the trailing arm. Top: coloured by the G magnitude of the red clump, as exemplified by the CMDs surrounding the panel (no extinction correction). Bottom: same projection, now coloured by distance, but for the RR Lyrae in our sample (a) as well as three different N-body simulations ((b) for LM10, (c) for V21, and (d) for P10). We note a clear correlation between the modulus of the proper motion vector and the distance, with small distances corresponding to larger proper motions. The data are, in general, well reproduced by the recently stripped material (light colours). The black lines correspond to the lower limit used in our selection of the peaks (see Table B.1). The V21 is the model that best represents the data. In darker colours, we show the second wrap of the leading arm, and we note that each model predicts a different distribution and region of overlap with the trailing tail.
Current usage metrics show cumulative count of Article Views (full-text article views including HTML views, PDF and ePub downloads, according to the available data) and Abstracts Views on Vision4Press platform.
Data correspond to usage on the plateform after 2015. The current usage metrics is available 48-96 hours after online publication and is updated daily on week days.
Initial download of the metrics may take a while.