Fig. 2.
Download original image
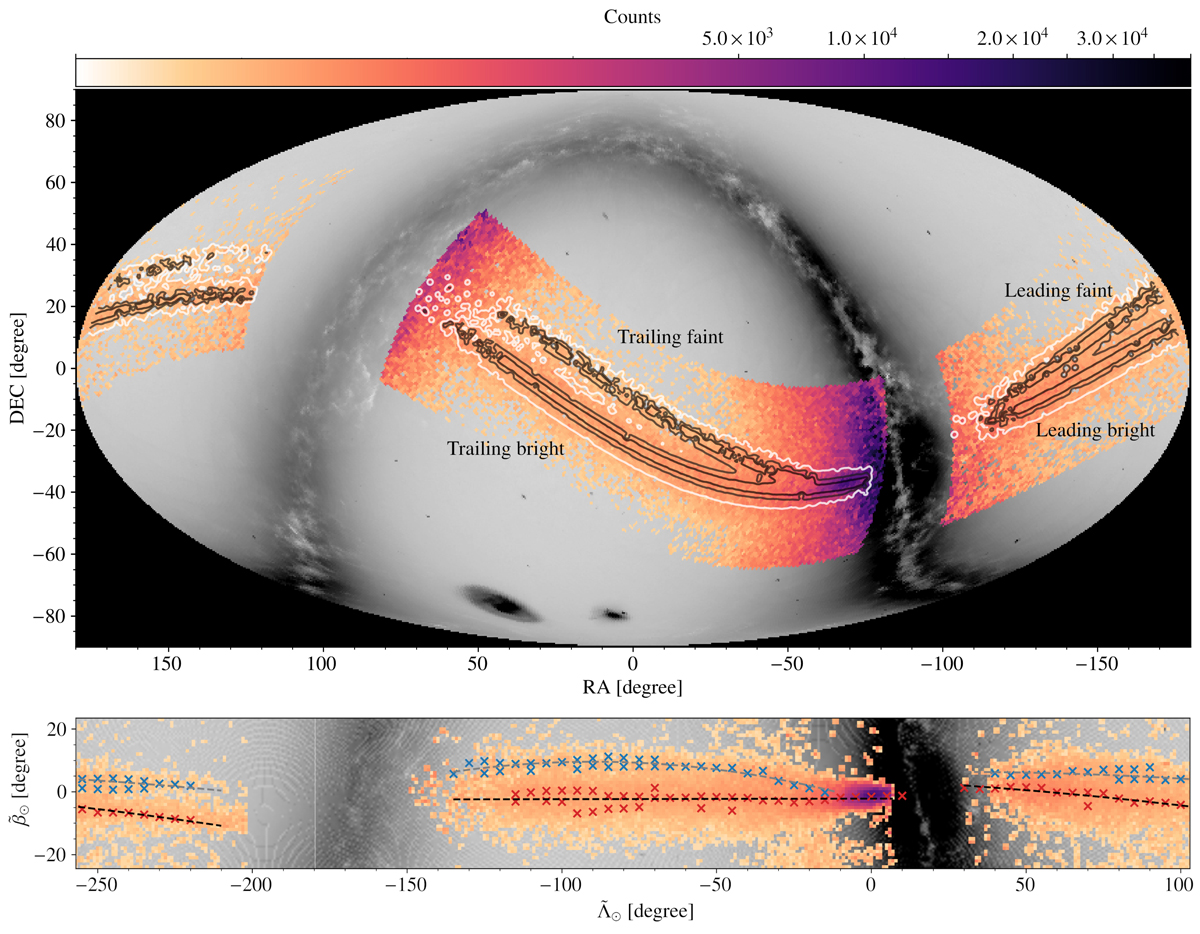
Sky distribution of the candidate Sgr stream stars. Top: mollweide projection of the histogram, in ICRS coordinates, of the counts obtained from the peaks selected in proper motion (Sect. 2.2). The contours are iso-probability lines of Prob(Sgr|![]() ), a score assigned to each source in the final catalogue based on the probability of being a Sgr stream star (see text). In the background, we included a black and white histogram of the input sample for reference. Bottom: histogram of the stars in our final sample, with bins of 1° × 1°, but in the Sgr reference frame (
), a score assigned to each source in the final catalogue based on the probability of being a Sgr stream star (see text). In the background, we included a black and white histogram of the input sample for reference. Bottom: histogram of the stars in our final sample, with bins of 1° × 1°, but in the Sgr reference frame (![]() ,
, ![]() ). The red (blue) crosses correspond to the peaks of the 1D WT associated with the bright (faint) branch, while the dashed lines represent the resulting polynomials (see Table 1). The Sgr stream appears as a four-tailed structure across the whole sky, for the first time, in a homogeneous astrometric sample.
). The red (blue) crosses correspond to the peaks of the 1D WT associated with the bright (faint) branch, while the dashed lines represent the resulting polynomials (see Table 1). The Sgr stream appears as a four-tailed structure across the whole sky, for the first time, in a homogeneous astrometric sample.
Current usage metrics show cumulative count of Article Views (full-text article views including HTML views, PDF and ePub downloads, according to the available data) and Abstracts Views on Vision4Press platform.
Data correspond to usage on the plateform after 2015. The current usage metrics is available 48-96 hours after online publication and is updated daily on week days.
Initial download of the metrics may take a while.