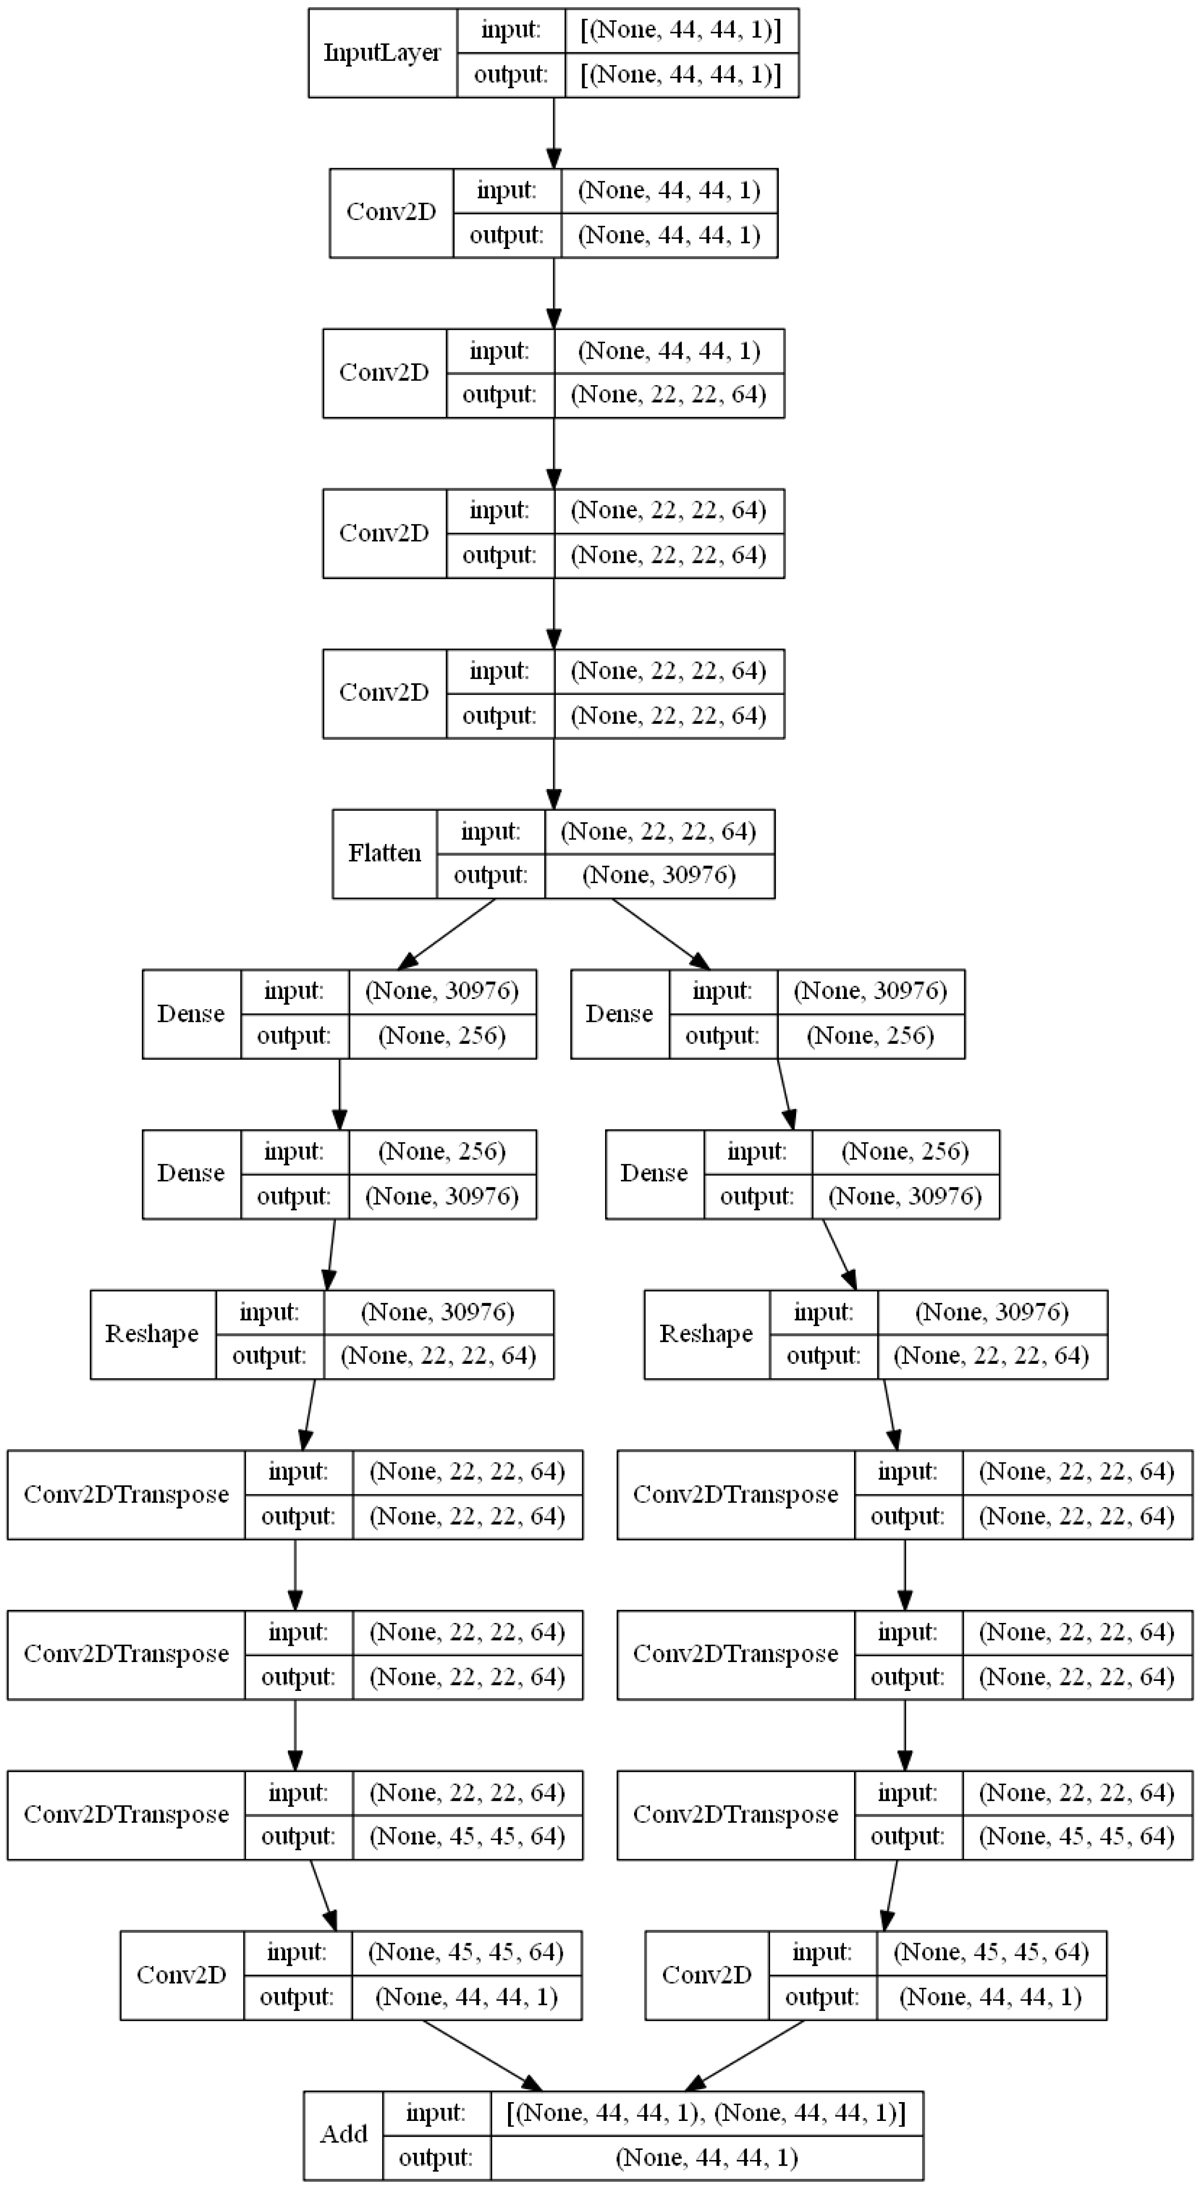
Fig. B.1.
Download original image
Architecture of the deblending auto-encoder. Each box represents a layer and the arrows show the connections between the different layers of the networks. The names indicated in the rectangles correspond to the different layer subclasses of the Keras API used in the model. The dimensions of the input and output of each layer are indicated in brackets. For convolutional layers the last dimension corresponds to the number of filters.
Current usage metrics show cumulative count of Article Views (full-text article views including HTML views, PDF and ePub downloads, according to the available data) and Abstracts Views on Vision4Press platform.
Data correspond to usage on the plateform after 2015. The current usage metrics is available 48-96 hours after online publication and is updated daily on week days.
Initial download of the metrics may take a while.