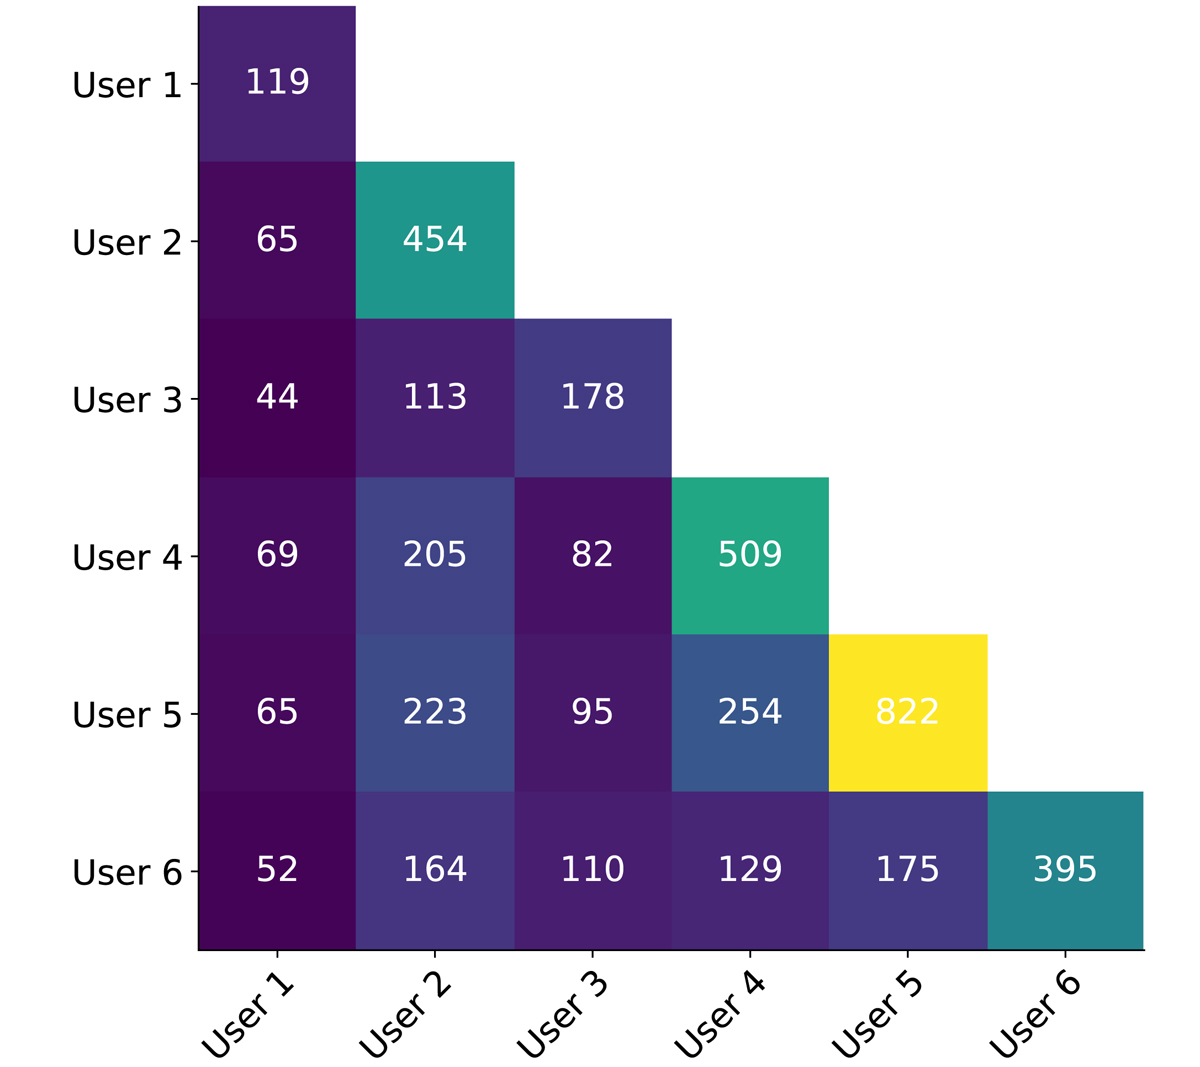
Fig. A.1.
Download original image
Illustration of the overlap between the visual classification of different users. The diagonal terms show the number of SL and ML labeled by each user during the first steps of the inspection, whereas the nondiagonal terms correspond to the number of ML and SL objects that are shared between the users in the corresponding rows and columns.
Current usage metrics show cumulative count of Article Views (full-text article views including HTML views, PDF and ePub downloads, according to the available data) and Abstracts Views on Vision4Press platform.
Data correspond to usage on the plateform after 2015. The current usage metrics is available 48-96 hours after online publication and is updated daily on week days.
Initial download of the metrics may take a while.