Fig. C.1.
Download original image
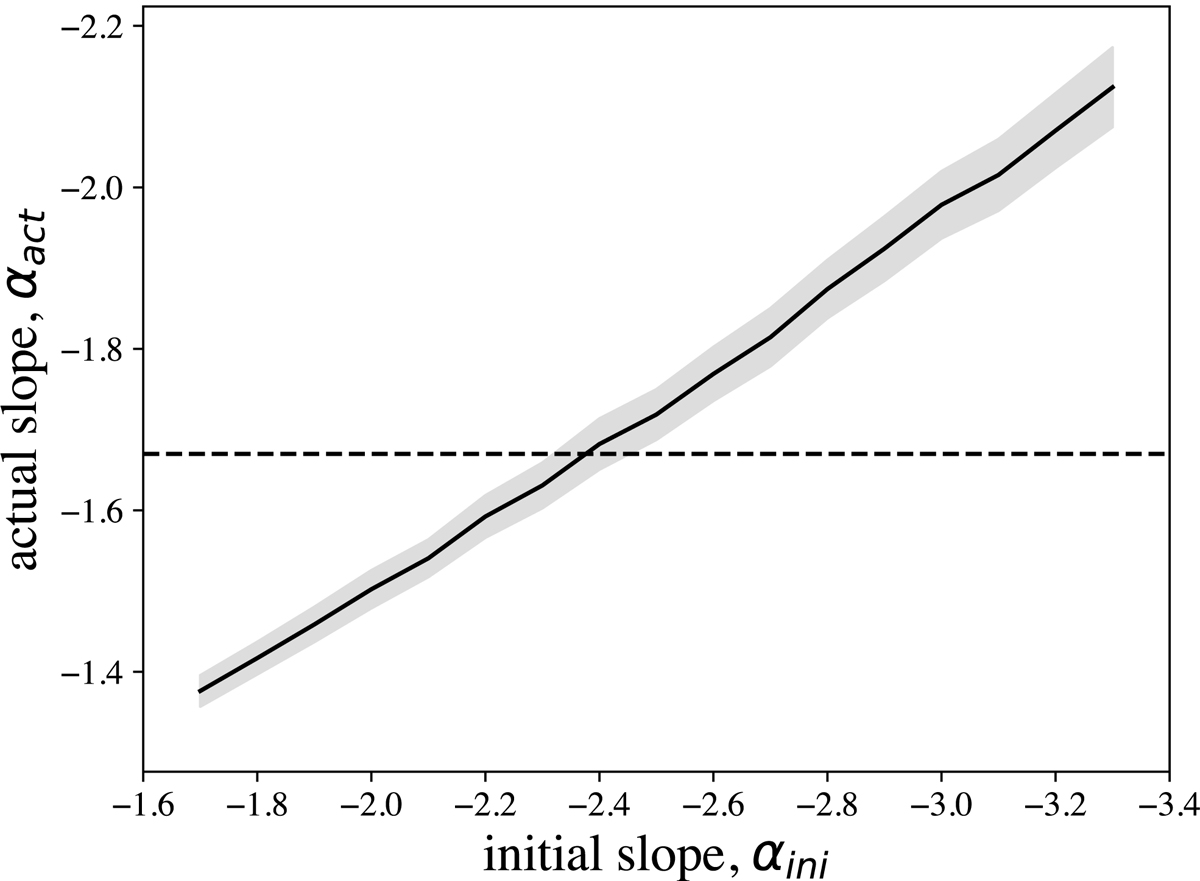
Cumulative size distribution approximated by a power law, N(> D)=N0Dα, where the α-value is the slope of a straight line in the log10N – log10D space. Here we show the actual slope, αact, and its standard error (grey area), of a synthetic Athor family resulting from the dynamical and collisional evolution of an initial distribution of family members with slope αini for 3 Gyr. The horizontal dashed line denotes the actual observed slope of the real Athor family (-1.67). The two curves cross at αini=-2.37, which indicates the initial slope of the cumulative size distribution of the family.
Current usage metrics show cumulative count of Article Views (full-text article views including HTML views, PDF and ePub downloads, according to the available data) and Abstracts Views on Vision4Press platform.
Data correspond to usage on the plateform after 2015. The current usage metrics is available 48-96 hours after online publication and is updated daily on week days.
Initial download of the metrics may take a while.