Fig. D.1.
Download original image
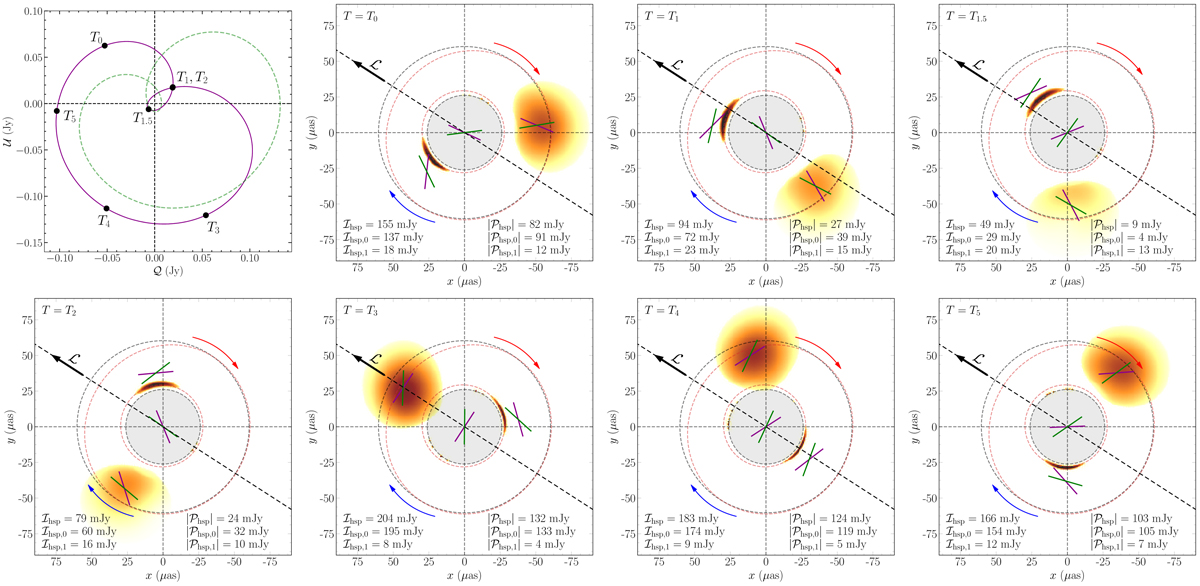
Spatially resolved appearance of the fiducial Keplerian model at times T1 − T5 matching observed times defined in Fig. 2. The first panel shows the prediction for the observed 𝒬-𝒰 loop shape with locations of individual snapshots being indicated (dark magenta line), as well as the intrinsic loop shape, after correcting for the Faraday rotation (dashed green line; see Appendix F). The remaining panels show the resolved system geometry at times T1 − T5 as a model prediction for the EHT observations on 2017 Apr 11. The projected angular momentum of the hot spot is indicated with ℒ and it points into the screen (i = 158°). Dashed black circles correspond to radii of 12 rg/D ≈ 60 μas and ![]() as (critical curve in the Schwarzschild spacetime), where D is the distance toward Sgr A*. Dashed red lines correspond to the primary and secondary image trajectories on the observer’s screen in the case of a point source emission. We report the total intensities and LP of the primary (direct image) and secondary (lensed image) components, as well as those of the unresolved image. Dark magenta ticks indicate the EVPA as it would be observed (corrupted by the Faraday rotation), and green ticks correspond to the model prediction with the Faraday rotation removed. Polarization ticks are shown for the primary and secondary image components, and for a total unresolved source (in the image center). Red and blue curved arrows indicate the receding and approaching side of the hot spot orbit, respectively.
as (critical curve in the Schwarzschild spacetime), where D is the distance toward Sgr A*. Dashed red lines correspond to the primary and secondary image trajectories on the observer’s screen in the case of a point source emission. We report the total intensities and LP of the primary (direct image) and secondary (lensed image) components, as well as those of the unresolved image. Dark magenta ticks indicate the EVPA as it would be observed (corrupted by the Faraday rotation), and green ticks correspond to the model prediction with the Faraday rotation removed. Polarization ticks are shown for the primary and secondary image components, and for a total unresolved source (in the image center). Red and blue curved arrows indicate the receding and approaching side of the hot spot orbit, respectively.
Current usage metrics show cumulative count of Article Views (full-text article views including HTML views, PDF and ePub downloads, according to the available data) and Abstracts Views on Vision4Press platform.
Data correspond to usage on the plateform after 2015. The current usage metrics is available 48-96 hours after online publication and is updated daily on week days.
Initial download of the metrics may take a while.