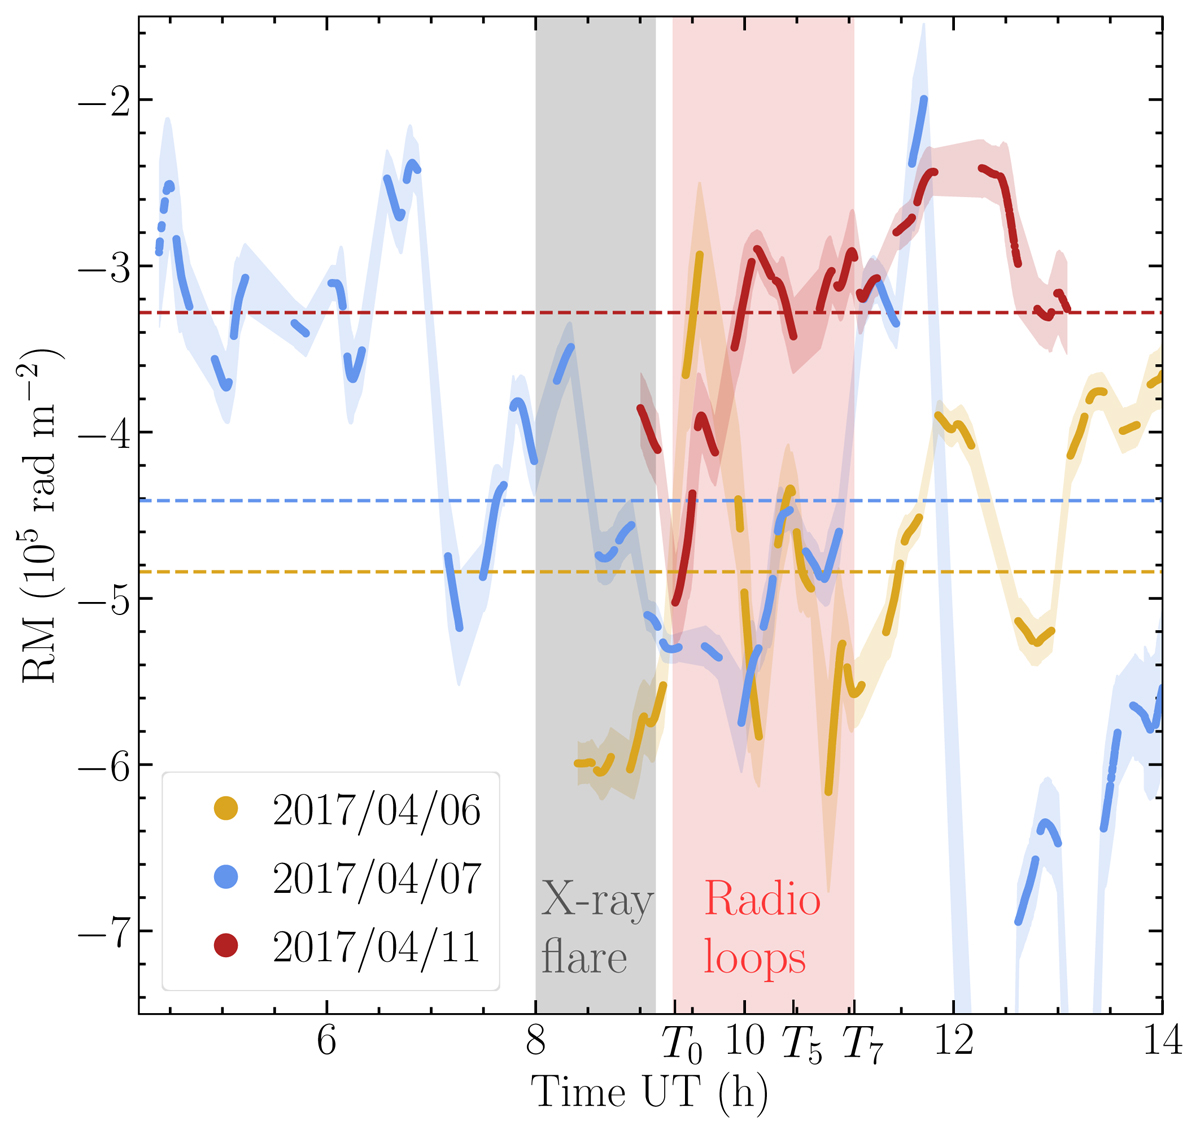
Fig. A.1.
Download original image
Rapid variation of the RM at millimeter wavelengths in Sgr A*. The plot corresponds to the RM fit with linear regression across all four bands on 4 s cadence, smoothed with a Gaussian filter with 6 min standard deviation, with color bands around the mean RM indicating the local signal standard deviation. Dashed lines represent the mean daily values reported by Goddi et al. (2021). We observe rapid swings of the RM on timescales ∼0.5 h, indicating a presence of the intrinsic Faraday screen component corresponding to the innermost region of the accretion flow. The vertical gray and red bands indicate the time range of the X-ray flare and polarimetric loops observed on 2017 Apr 11.
Current usage metrics show cumulative count of Article Views (full-text article views including HTML views, PDF and ePub downloads, according to the available data) and Abstracts Views on Vision4Press platform.
Data correspond to usage on the plateform after 2015. The current usage metrics is available 48-96 hours after online publication and is updated daily on week days.
Initial download of the metrics may take a while.