Fig. 3.
Download original image
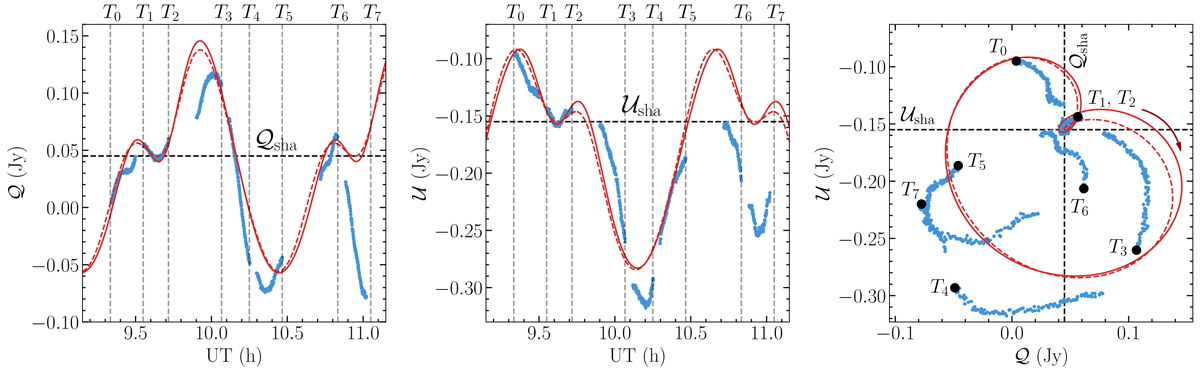
Comparison between ALMA data in the loopy period on 2017 Apr. 11 (blue dots) and hot spot model prediction for the inclination i = 158°, the orbital radius rorb = 11 M, the vertical magnetic field, and the spin a* = 0. We compare predictions of a simplified semi-analytic model (dashed red lines, Appendix B and Gelles et al. 2021) with a slow light, full radiative transfer model (continuous red line, Vos et al. 2022). A static, linearly polarized component of |𝒫sha|=|𝒬sha + i 𝒰sha|=0.16 Jy and χsha = −37° was coherently added to the hot spot models, and the loop position angle was adjusted to match the observations.
Current usage metrics show cumulative count of Article Views (full-text article views including HTML views, PDF and ePub downloads, according to the available data) and Abstracts Views on Vision4Press platform.
Data correspond to usage on the plateform after 2015. The current usage metrics is available 48-96 hours after online publication and is updated daily on week days.
Initial download of the metrics may take a while.