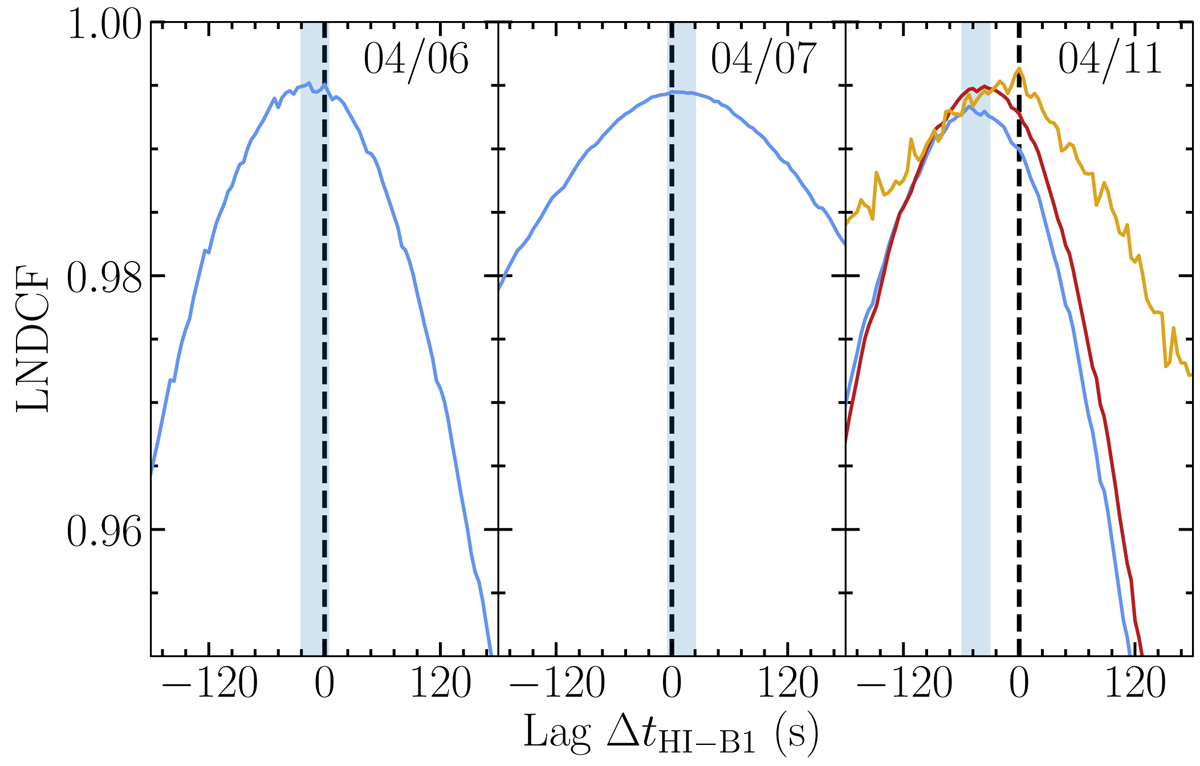
Fig. G.1.
Download original image
Polarized flux density |𝒫| correlations between 229 GHz (HI band) and 213 GHz (B1 band) frequencies (blue curves). Locations of the correlation maxima with associated uncertainties are indicated by blue shaded regions. For 2017 Apr 6 and 7, no significant delay has been detected. On 2017 Apr 11, the B1 band lags behind the HI band by 45 ± 15 s. The result is consistent if only the first 2 h of the Apr 11 observations are used (i.e., before 11.0 UT, corresponding to the loopy period, red curve). The lag disappears if only the latter part of the observations is analyzed (after 11.0 UT, orange curve).
Current usage metrics show cumulative count of Article Views (full-text article views including HTML views, PDF and ePub downloads, according to the available data) and Abstracts Views on Vision4Press platform.
Data correspond to usage on the plateform after 2015. The current usage metrics is available 48-96 hours after online publication and is updated daily on week days.
Initial download of the metrics may take a while.