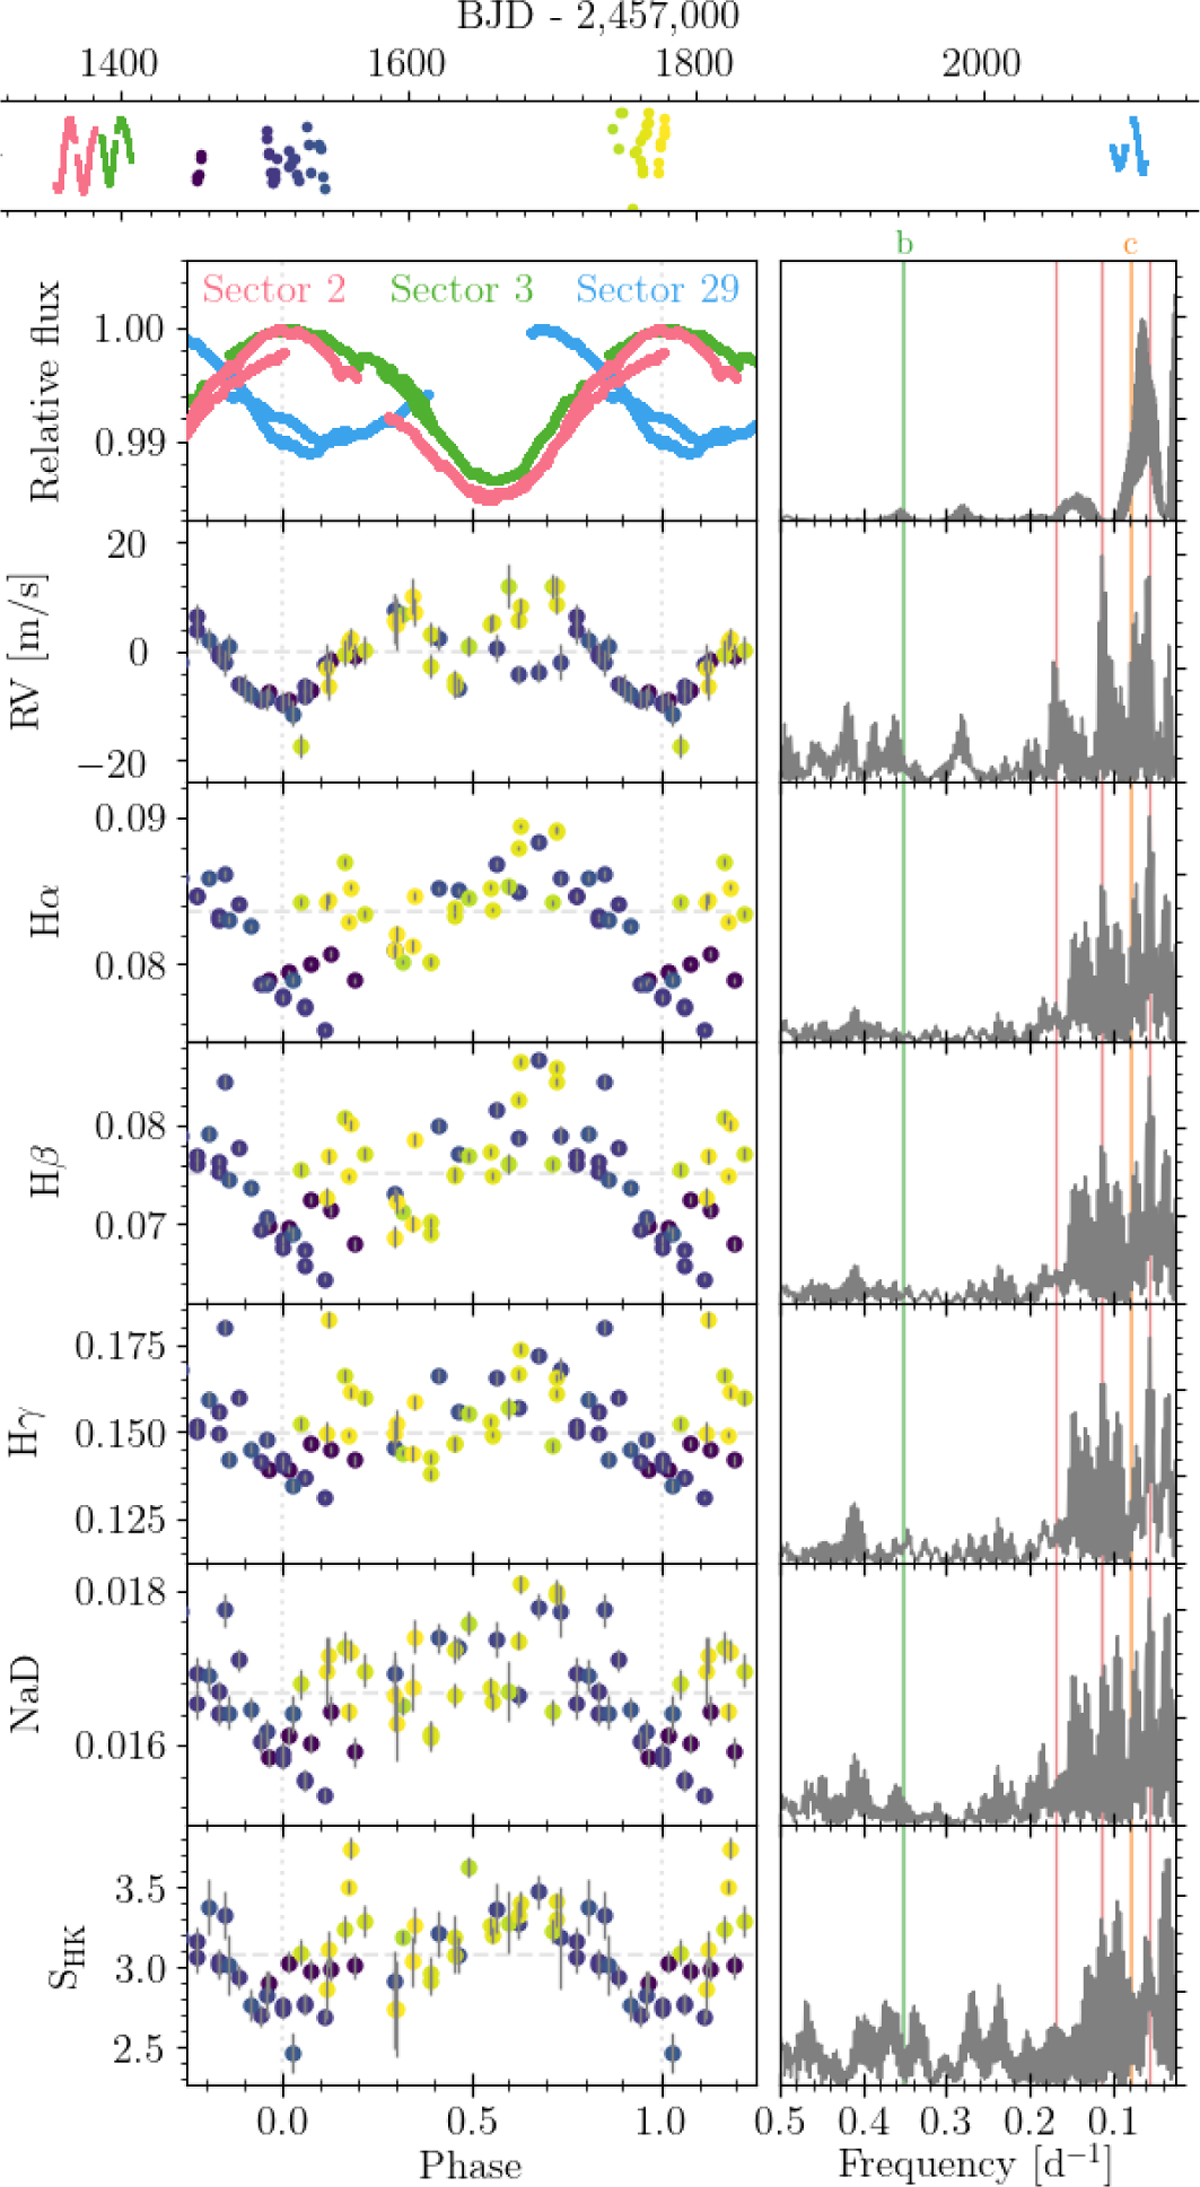
Fig. 6

Download original image
TESS photometry and HARPS RV and activity indicators folded at the stellar rotational period. To compute the phase, we used the median period of the QPC from the adopted RV modelling (17.733 days) and one arbitrary epoch (BJD 2,458,452.3). The TESS photometry was better folded with a slightly different period at the expense of the RVs. We favoured the general case in which the photometric variability observed by TESS about 2 yr apart could originate from different active regions at different longitudes of the stellar surface. From top to bottom: Times of the TESS (red, green, and blue, depending on the sector) and HARPS observations (at times indicated by the colour of the circles) shifted by the median and scaled with the standard deviation. TESS SAP light curve in which the transits of GJ 3090 b are masked are coloured by sector. HARPS RV. The MAP Keplerians of the adopted RV modelling are subtracted. HARPS Hα, Hβ, Hγ, NaD, and SHK activity indicators (their median is marked by the horizontal line). The panels on the right show the GLS periodogram (in frequency space) of the quantity shown at the left. Vertical lines mark the period of planet b (green), planet c (orange), and Prot, Prot/2, and Prot/3 (red). The HARPS observations started 45 days after the end of TESS sector 3 and ended 311 days before the beginning of sector 29.
Current usage metrics show cumulative count of Article Views (full-text article views including HTML views, PDF and ePub downloads, according to the available data) and Abstracts Views on Vision4Press platform.
Data correspond to usage on the plateform after 2015. The current usage metrics is available 48-96 hours after online publication and is updated daily on week days.
Initial download of the metrics may take a while.


