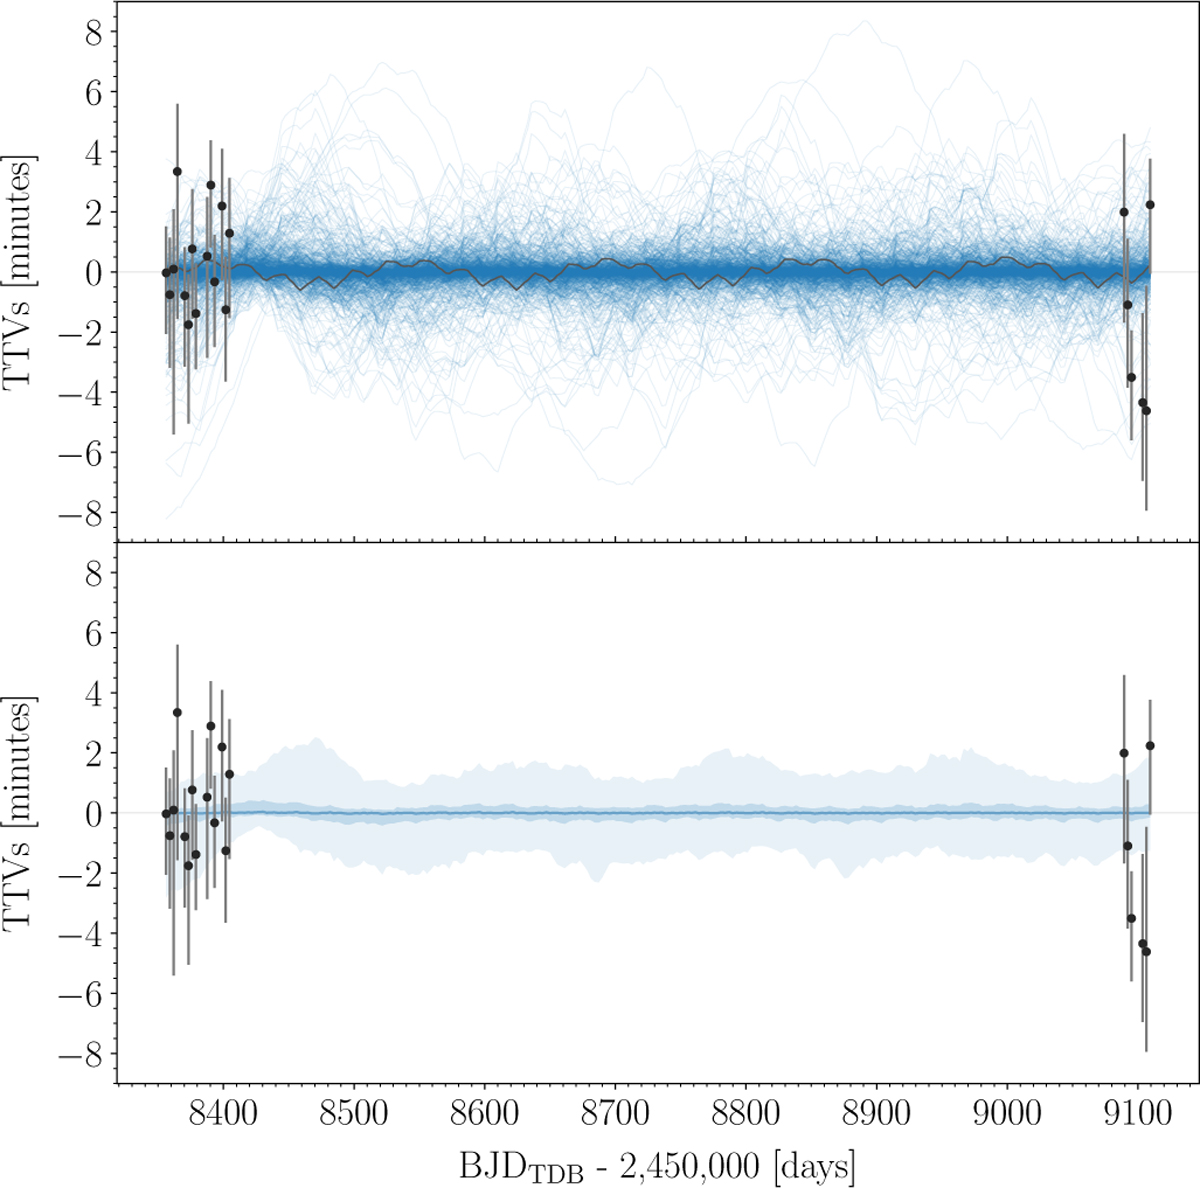
Fig. A.5

Download original image
Posterior TTVs of GJ 3090 b from the photodynamical modelling (blue) compared with the with individual transit time determinations (black error bars). Top panel: One thousand random draws from the posterior distribution are shown. To compute the TTVs, we used a different linear ephemeris for each posterior sample and the period and time of conjunction from Sect. 4.2 for the individual transit time determinations. Lower panel: The 68.3%, and 95.4% CIs are plotted in different intensities of blue.
Current usage metrics show cumulative count of Article Views (full-text article views including HTML views, PDF and ePub downloads, according to the available data) and Abstracts Views on Vision4Press platform.
Data correspond to usage on the plateform after 2015. The current usage metrics is available 48-96 hours after online publication and is updated daily on week days.
Initial download of the metrics may take a while.


