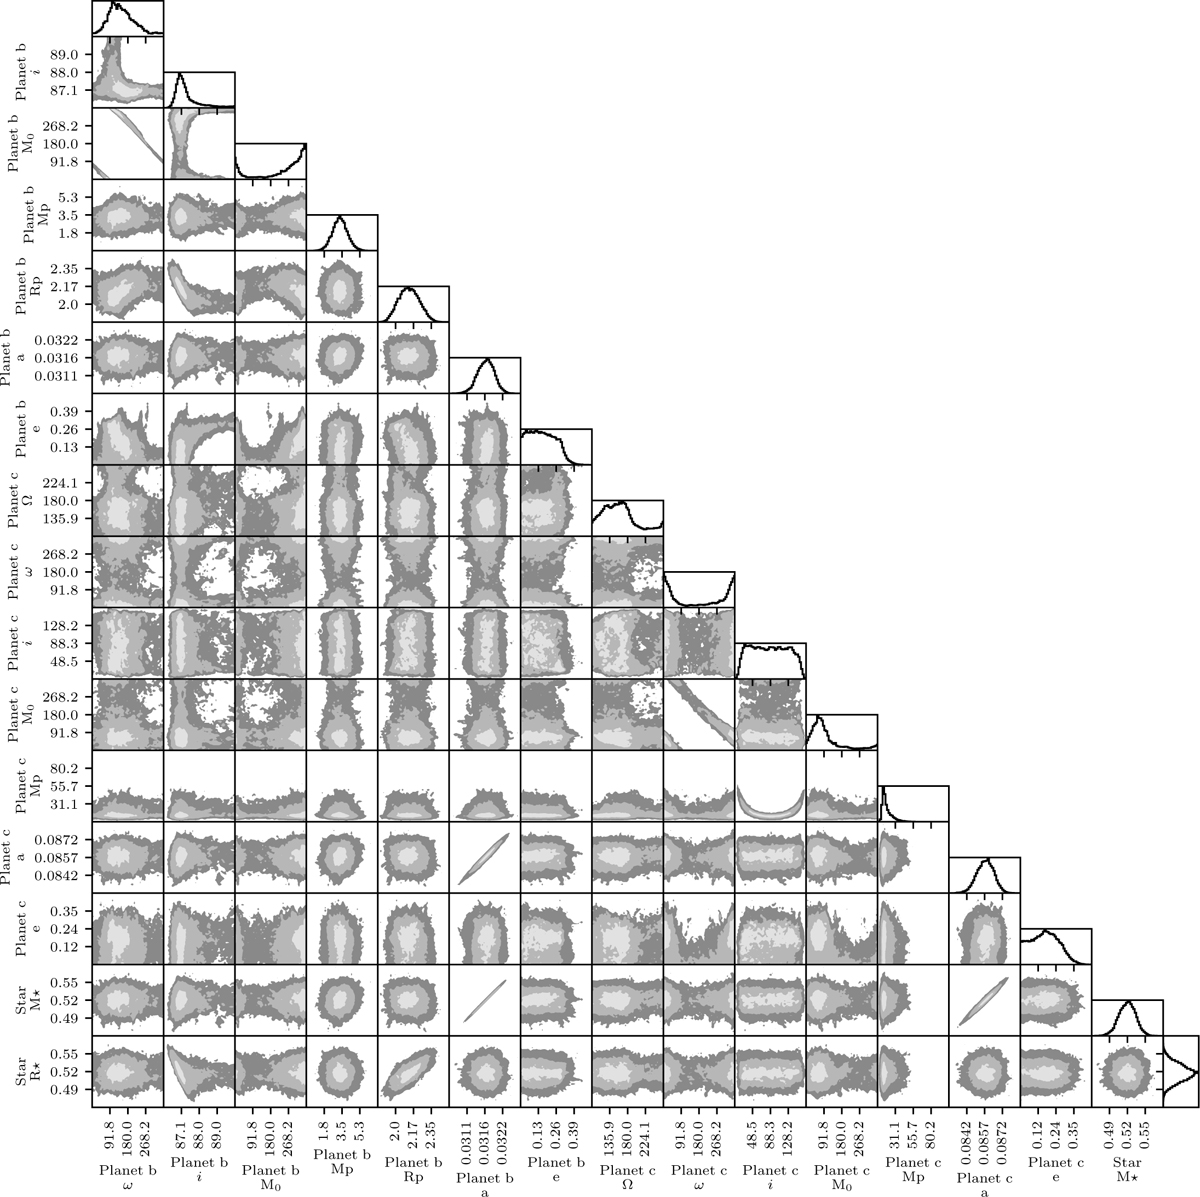
Fig. A.4

Download original image
Two-parameter joint posterior distributions for the most relevant model parameters of the photodynamical modelling with the stability constrain. The 39.3, 86.5, and 98.9% two-variable joint confidence regions are denoted by three different grey levels. In the case of a Gaussian posterior, these regions project on to the one-dimensional 1, 2, and 3 σ intervals. The histogram of the marginal distribution for each parameter is shown at the top of each column, except for the parameter on the last line, which is shown at the end of the line. Units are the same as in Table 3.
Current usage metrics show cumulative count of Article Views (full-text article views including HTML views, PDF and ePub downloads, according to the available data) and Abstracts Views on Vision4Press platform.
Data correspond to usage on the plateform after 2015. The current usage metrics is available 48-96 hours after online publication and is updated daily on week days.
Initial download of the metrics may take a while.


