Fig. A.3

Download original image
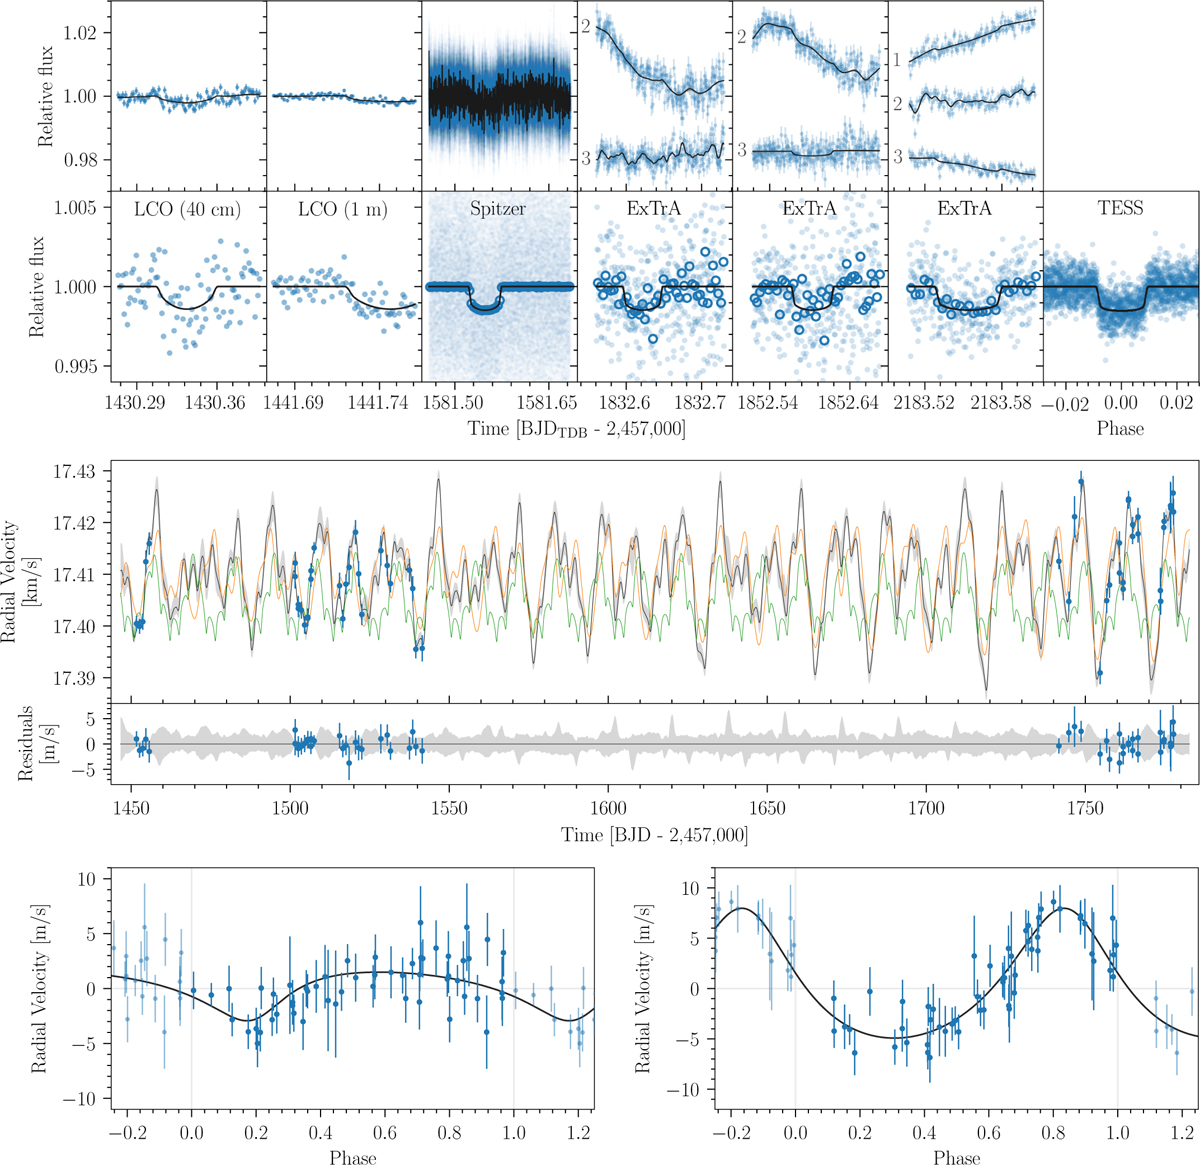
Keplerian modelling of transit photometry and RVs of GJ 3090. Top panel: Transit photometry observations (top, blue error bars), median model (black line), and 68% CI (grey band, barely visible) computed from 1000 random posterior samples. For the ExTrA observations, the label numbers (1, 2, and 3) correspond to each of the ExTrA telescopes (offset for clarity). Data (bottom, blue dots) detrended with the MAP model (black line). For the Spitzer and ExTrA observations, 5-minute bins are shown as blue open circles. Middle panel: HARPS RVs (top, blue error bars, as computed from the spectra), median model (black line), 68% CI (grey band), two-Keplerian MAP model (green line), and the mean of the predictive distribution of the kernel for the MAP model (orange line). Residuals to the median model (bottom). Bottom panel: HARPS RVs (bottom, blue error bars) corrected for the MAP model of activity (the orange line in the middle panel) and the Keplerian orbit of planet c, folded at the period of planet b. The black line is the corresponding Keplerian model of GJ 3090 b with the parameters of the MAP. The same is shown for planet c in the right panel.
Current usage metrics show cumulative count of Article Views (full-text article views including HTML views, PDF and ePub downloads, according to the available data) and Abstracts Views on Vision4Press platform.
Data correspond to usage on the plateform after 2015. The current usage metrics is available 48-96 hours after online publication and is updated daily on week days.
Initial download of the metrics may take a while.


