Fig. 16

Download original image
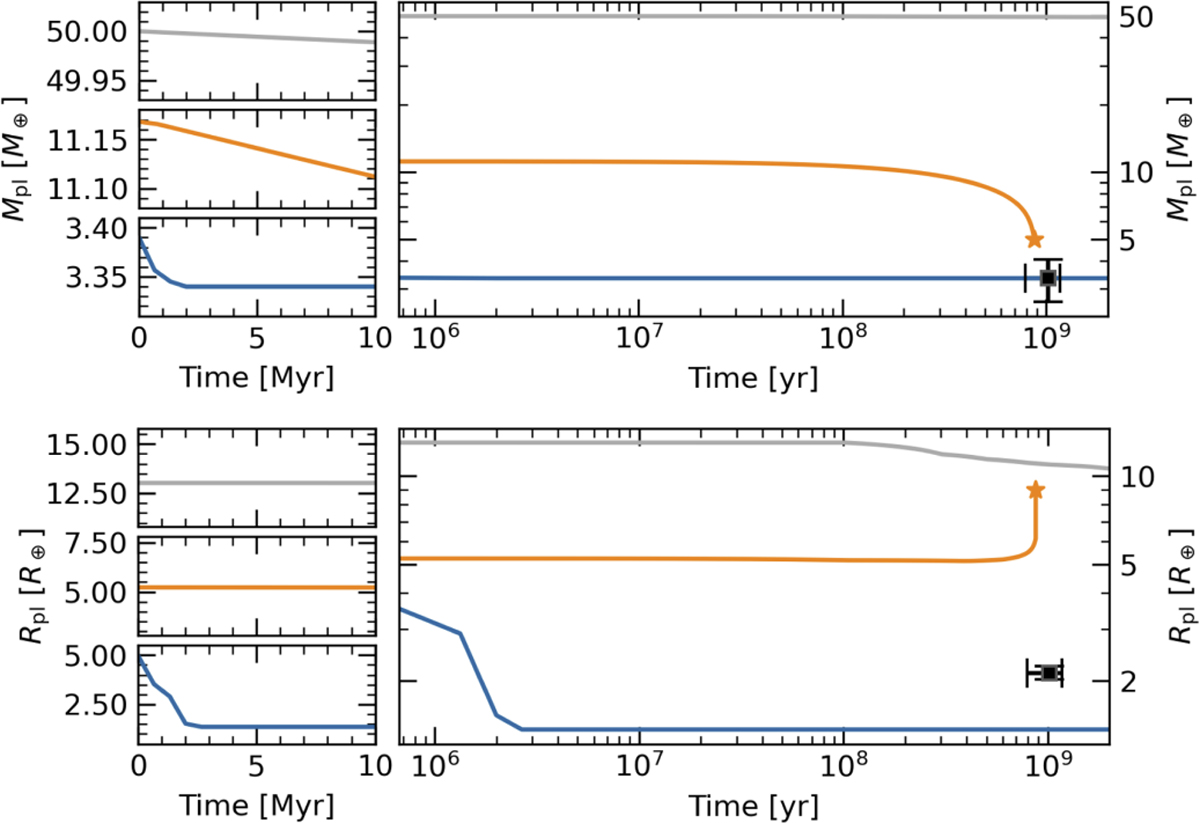
Evolution of three representative simulations of GJ 3090 b from the exploration of Sect. 5.2, represented by three different colours. Top: evolution of the mass. Bottom: evolution of the radius. The inset on the left zooms into the first 10 Myr of each simulation. The star marks tidal disruption. The two black points are the observed mass and radius of GJ 3090 b at the inferred age of the system.
Current usage metrics show cumulative count of Article Views (full-text article views including HTML views, PDF and ePub downloads, according to the available data) and Abstracts Views on Vision4Press platform.
Data correspond to usage on the plateform after 2015. The current usage metrics is available 48-96 hours after online publication and is updated daily on week days.
Initial download of the metrics may take a while.


