Fig. 12.
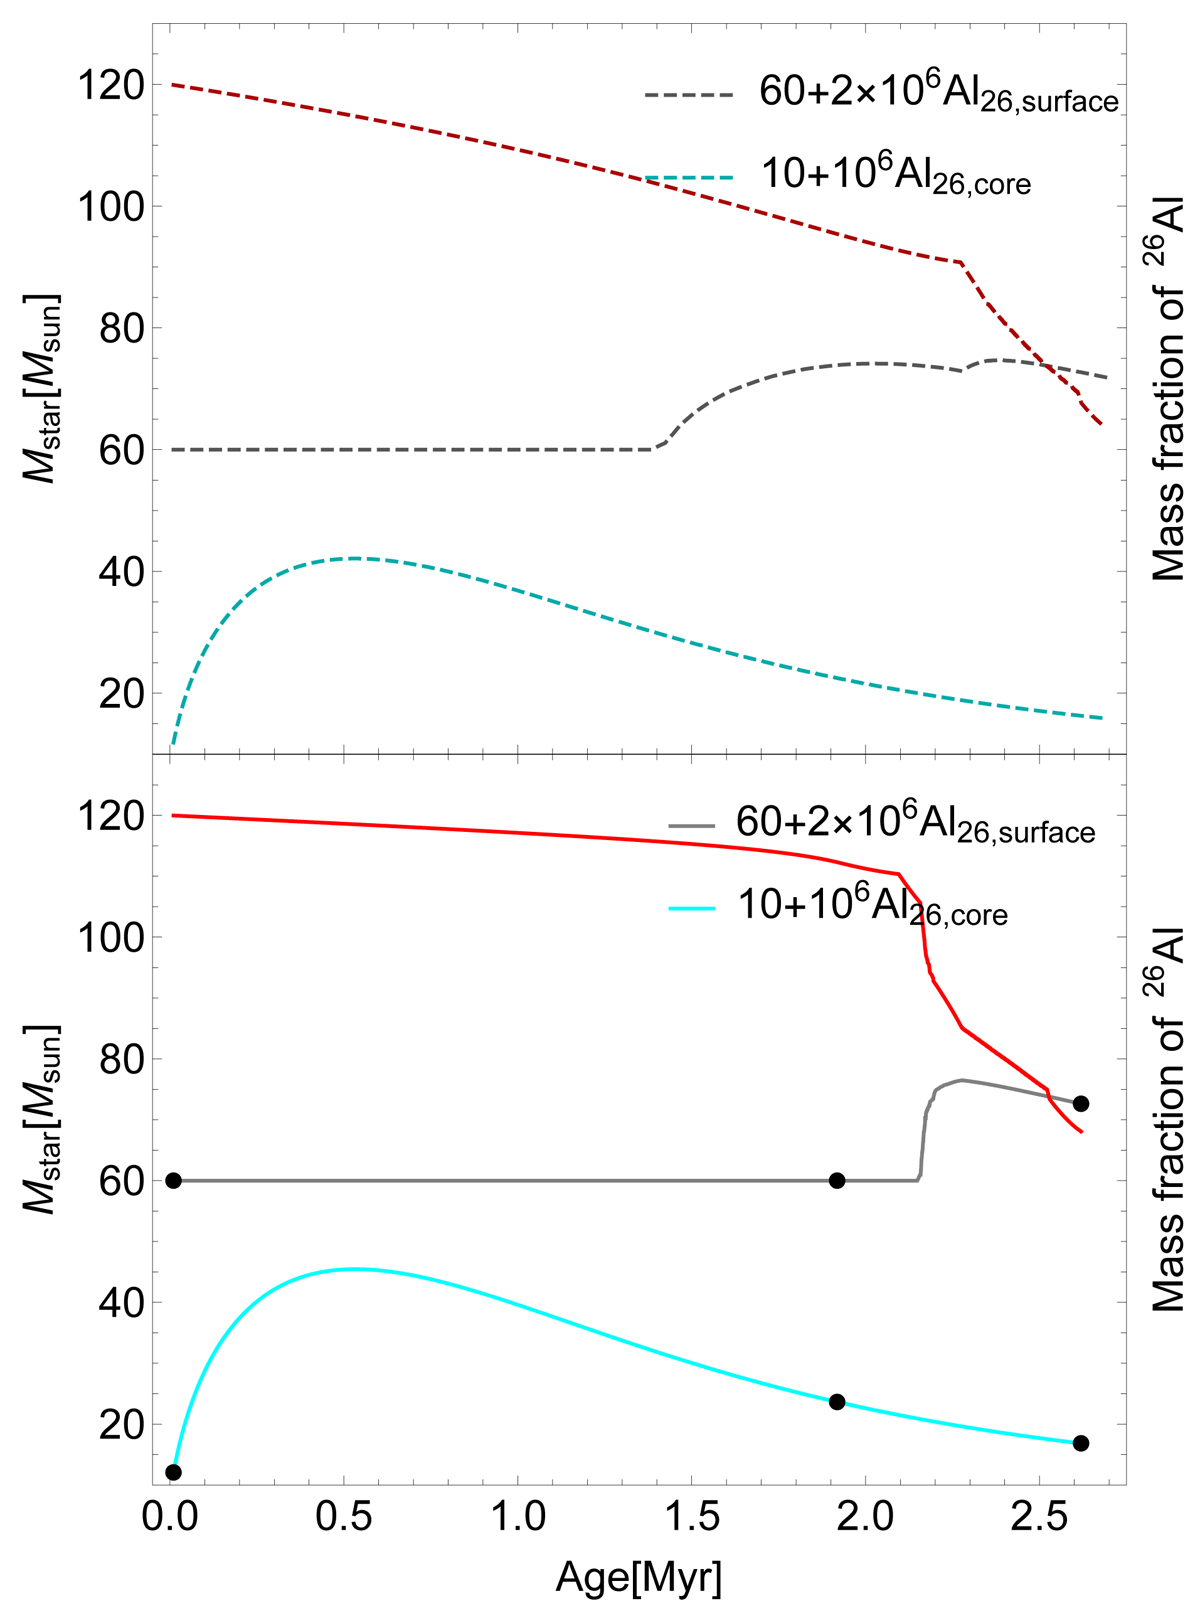
Download original image
Evolution as a function of time of the total mass (red curve), of the mass fraction of 26Al at the centre and at the surface of 120 M⊙ at Z = 0.014. Top panel: the case when the Vink’s formula for the mass-loss rate is adopted. Bottom panel: the case when the new rates obtained from hydrodynamic wind models are used. Note that making the plot more easily readable the curves for the mass fraction have been obtained by multiplying the mass fraction by a constant factor and the starting point of each curves has been shifted upwards along the Y axis (see the figure for the adopted values). Black dots represent the same as indicated in Fig. 6.
Current usage metrics show cumulative count of Article Views (full-text article views including HTML views, PDF and ePub downloads, according to the available data) and Abstracts Views on Vision4Press platform.
Data correspond to usage on the plateform after 2015. The current usage metrics is available 48-96 hours after online publication and is updated daily on week days.
Initial download of the metrics may take a while.