Fig. 10.
Download original image
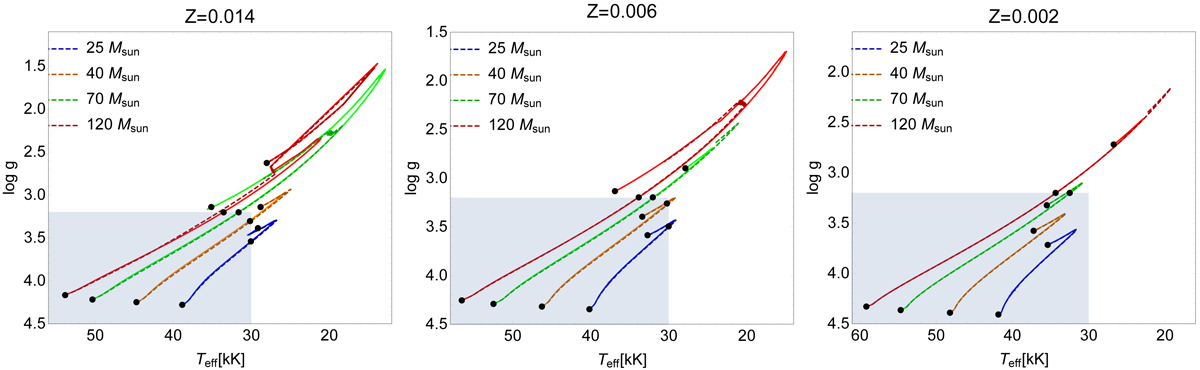
Evolutionary tracks across the spectroscopic Hertzsprung-Russell diagram (Langer & Kudritzki 2014) for model stars without rotation, calculated for self-consistent tracks (solid lines) and for classical tracks (dashed lines). Grey shaded area represents the region where self-consistent m-CAK prescription is valid (Teff ≥ 30, log g ≥ 3.2, see Gormaz-Matamala et al. 2022). Black dots represent the same as indicated in Fig. 6.
Current usage metrics show cumulative count of Article Views (full-text article views including HTML views, PDF and ePub downloads, according to the available data) and Abstracts Views on Vision4Press platform.
Data correspond to usage on the plateform after 2015. The current usage metrics is available 48-96 hours after online publication and is updated daily on week days.
Initial download of the metrics may take a while.