Fig. 10
Download original image
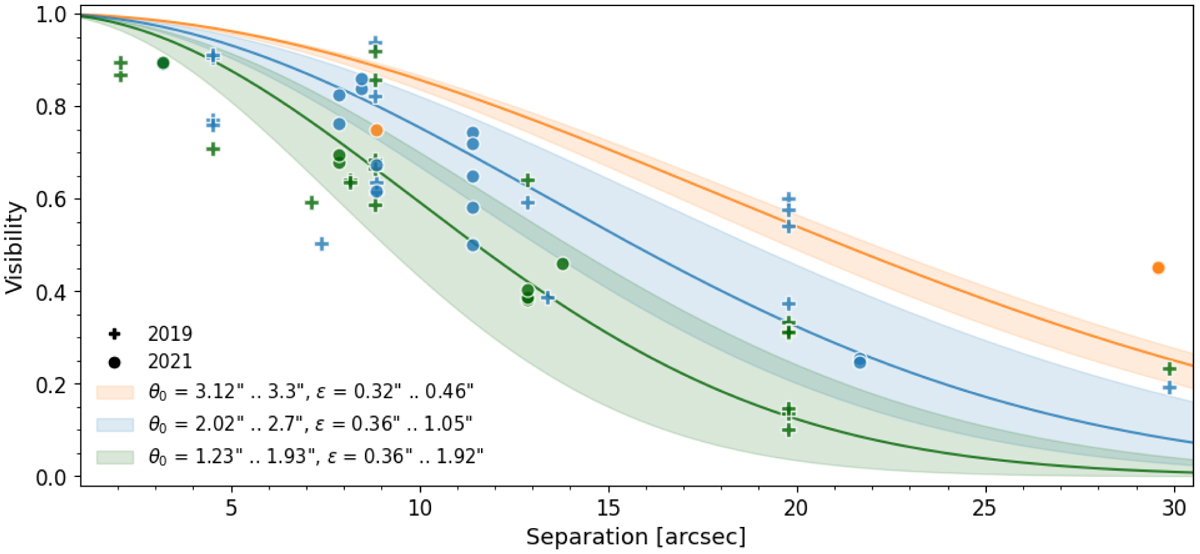
Observed contrast loss at 2.2 μm versus off-axis separation for the ATs. The three curves indicate the typical contrast loss for different seeing and isoplanatic angle values as expected from atmospheric turbulence following Elhalkouj et al. (2008). Crosses represent data from GRAVITY Wide observations with the prototype implementation in November 2019, while circles represent data from GRAVITY Wide commissioning in December 2021. Seeing and isoplanatic angle values are measured by the MASS-DIMM at the Paranal observatory, and are defined at 500 nm.
Current usage metrics show cumulative count of Article Views (full-text article views including HTML views, PDF and ePub downloads, according to the available data) and Abstracts Views on Vision4Press platform.
Data correspond to usage on the plateform after 2015. The current usage metrics is available 48-96 hours after online publication and is updated daily on week days.
Initial download of the metrics may take a while.