Fig. 6
Download original image
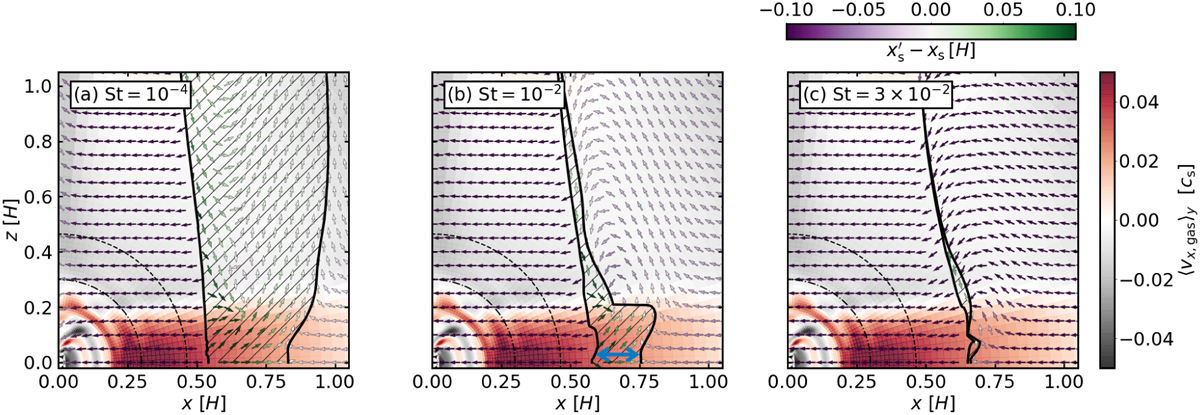
Vector field of dust velocities in the cases with St = 10−4 (left panel), 10−2 (middle panel), and 3 × 10⁻² (right panel) under the common gas flow obtained from m03-hw001. The color contour from red to black represents the x component of the gas flow velocity averaged in the y direction within the calculation domain of hydrodynamical simulation around a planet, 〈vx,gas〉y. Arrows represent the direction of movement of dust particles. The color contour of the arrows from green to purple represents the distance of drift of a dust particle after one synodical orbit. The hatched region enclosed by black curves corresponds to the forbidden region. The two-headed blue arrow in panel b can be compared to the region shown by the thick blue lines in Fig. 2b. The dotted and dashed lines are the Bondi and Hill radii of the planet, respectively. Thanks to the symmetry of the system, we only focus on the region where z ≥ 0. We discuss the dust motion in the x-z plane in detail in Appendix F motion within the forbidden region.
Current usage metrics show cumulative count of Article Views (full-text article views including HTML views, PDF and ePub downloads, according to the available data) and Abstracts Views on Vision4Press platform.
Data correspond to usage on the plateform after 2015. The current usage metrics is available 48-96 hours after online publication and is updated daily on week days.
Initial download of the metrics may take a while.