Fig. 3.
Download original image
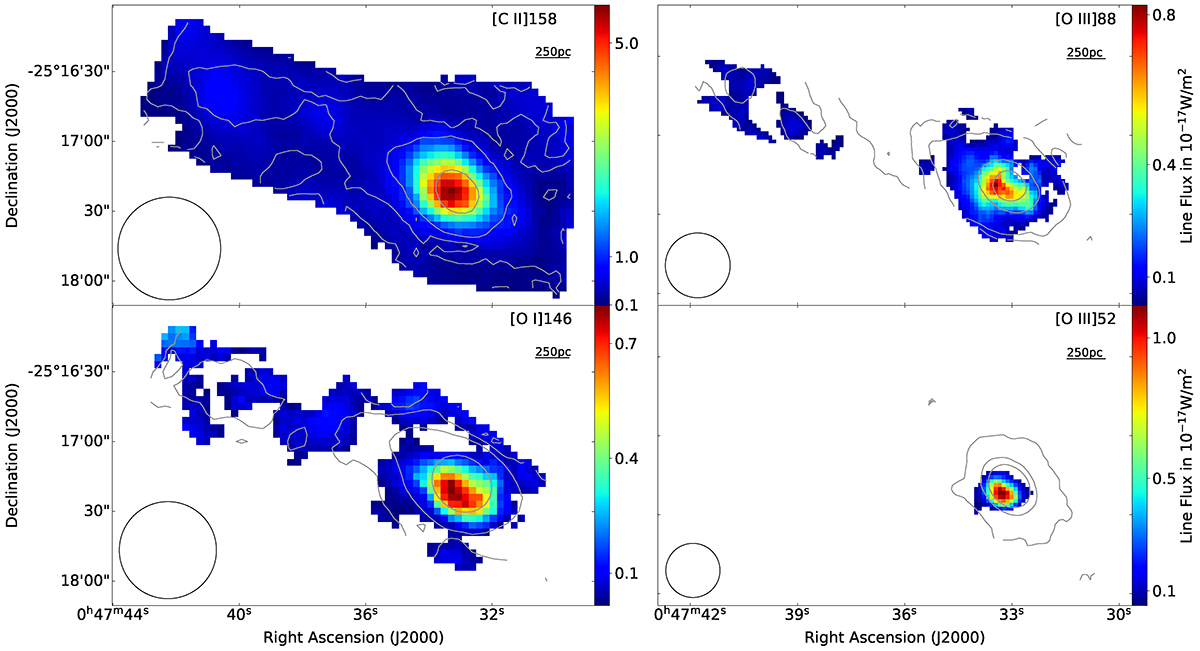
Line flux maps from the SOFIA/FIFI-LS observations. Colour maps show the line flux in 10−17 W m−2 on a 3″ × 3″ (left column) and 1.5″ × 1.5″ (right column) grid, respectively. Pixels with a S/N smaller than 3 are masked. The black circles depict the aperture used to extract the spectrum from the nuclear region (Sect. 2.3.1). We also show contours from the fitted underlying continuum (grey).
Current usage metrics show cumulative count of Article Views (full-text article views including HTML views, PDF and ePub downloads, according to the available data) and Abstracts Views on Vision4Press platform.
Data correspond to usage on the plateform after 2015. The current usage metrics is available 48-96 hours after online publication and is updated daily on week days.
Initial download of the metrics may take a while.