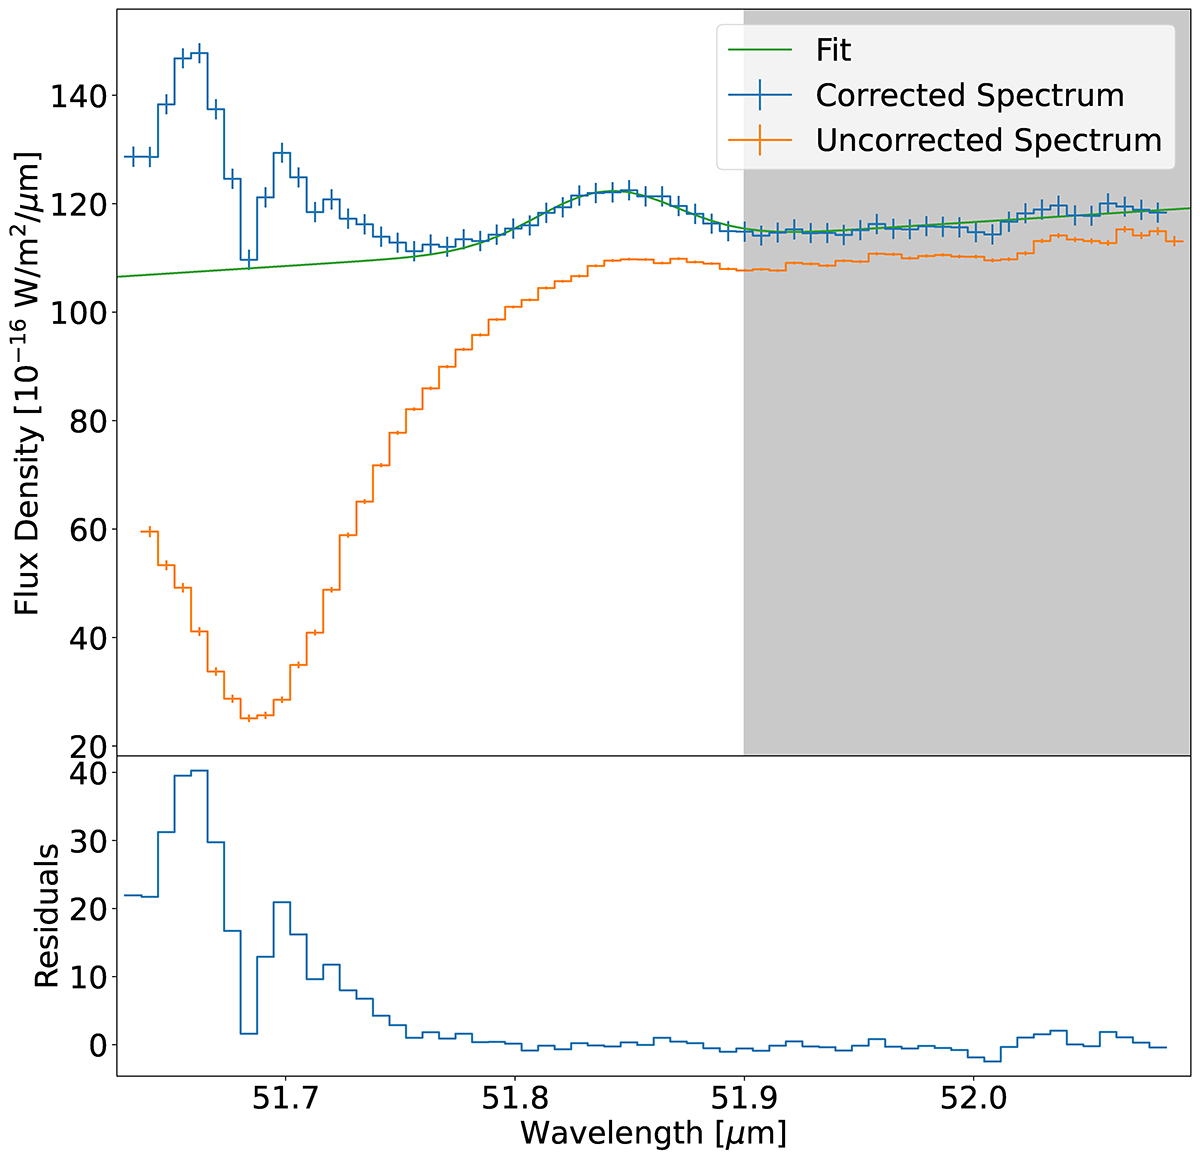
Fig. 2.
Download original image
Spectra of the pipeline spaxel (1.5″ × 1.5″) located toward the nucleus. The orange spectrum shows the observed spectrum (including errors from the ramp fit) without correction for atmospheric transmission. The telluric absorption feature at 51.7 μm can clearly be seen in the continuum. The blue spectrum shows the pipeline-corrected spectrum, including the errors determined as described in Sect. 2.1. The grey area shows the spectral region used to calculate flux density uncertainties. Green shows the best fit from the Monte Carlo method.
Current usage metrics show cumulative count of Article Views (full-text article views including HTML views, PDF and ePub downloads, according to the available data) and Abstracts Views on Vision4Press platform.
Data correspond to usage on the plateform after 2015. The current usage metrics is available 48-96 hours after online publication and is updated daily on week days.
Initial download of the metrics may take a while.