Fig. 10.
Download original image
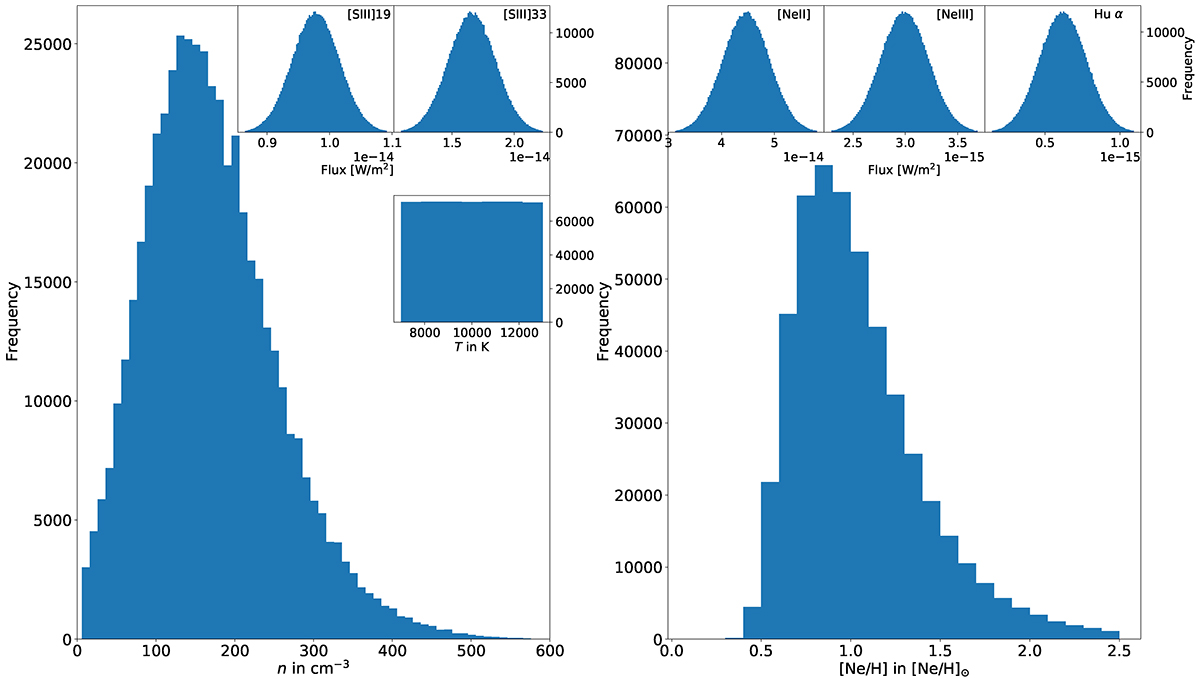
Results from the Monte Carlo simulation to derive the hydrogen density (Sect. 3.2) and the Ne/H abundance ratio (Sect. 3.3). Left: main plot showing the derived density in 10 cm−3 bins. Inset plots show histograms of the randomly picked temperature (uniform distribution, 1000 K bins), and integrated line fluxes for [S III]19 μm and [S III]33 μm. Right: inset plots again showing histograms of the randomly picked integrated line fluxes of [Ne II]13 μm, [Ne III]16 μm, and Hu α. From the line fluxes, temperature, and density, we obtained the Ne/H abundance ratio in solar units, which is shown in the main plot (0.1 bins).
Current usage metrics show cumulative count of Article Views (full-text article views including HTML views, PDF and ePub downloads, according to the available data) and Abstracts Views on Vision4Press platform.
Data correspond to usage on the plateform after 2015. The current usage metrics is available 48-96 hours after online publication and is updated daily on week days.
Initial download of the metrics may take a while.