Fig. 3.
Download original image
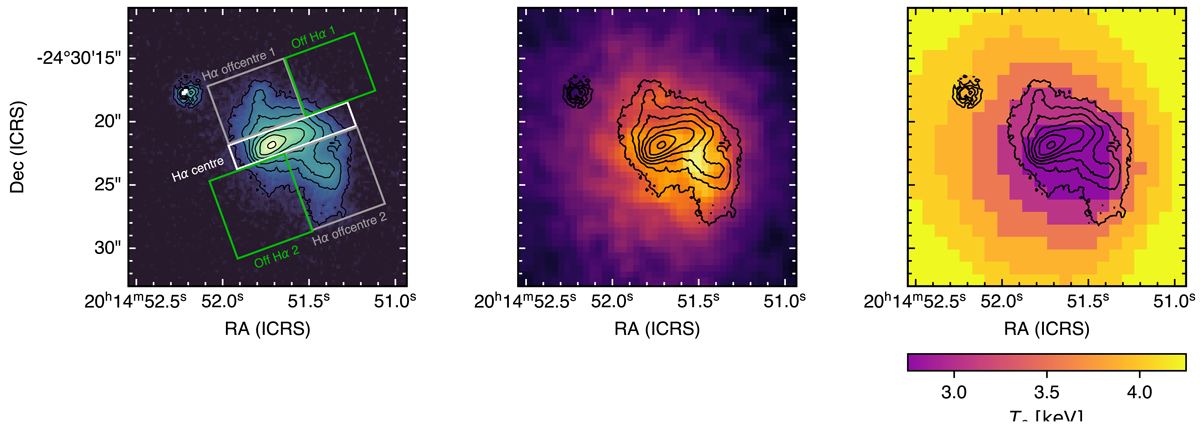
SOAR Hα imaging in comparison to the X-ray properties of RXC J2014.8−2430. Left: SOAR net Hα image. The regions used for spectral extractions reported in Table 2 are shown here. The white box labelled ‘H-α centre’ corresponds to the region used for spectroscopy. We note that the bright source to the north-east of the Hα peak is a foreground star. Middle: Chandra X-ray surface brightness from Fig. 1 (left) with SOAR contours from the left panel. Right: temperature map from Fig. 1 (right). The peak in the Hα emission is offset from the peak in the X-ray surface brightness. However, the south-western spur in the Hα emission appears to trace the coolest, brightest gas seen in X-ray. The images are 22″ wide, corresponding to 59.3 kpc.
Current usage metrics show cumulative count of Article Views (full-text article views including HTML views, PDF and ePub downloads, according to the available data) and Abstracts Views on Vision4Press platform.
Data correspond to usage on the plateform after 2015. The current usage metrics is available 48-96 hours after online publication and is updated daily on week days.
Initial download of the metrics may take a while.