Fig. B.1.
Download original image
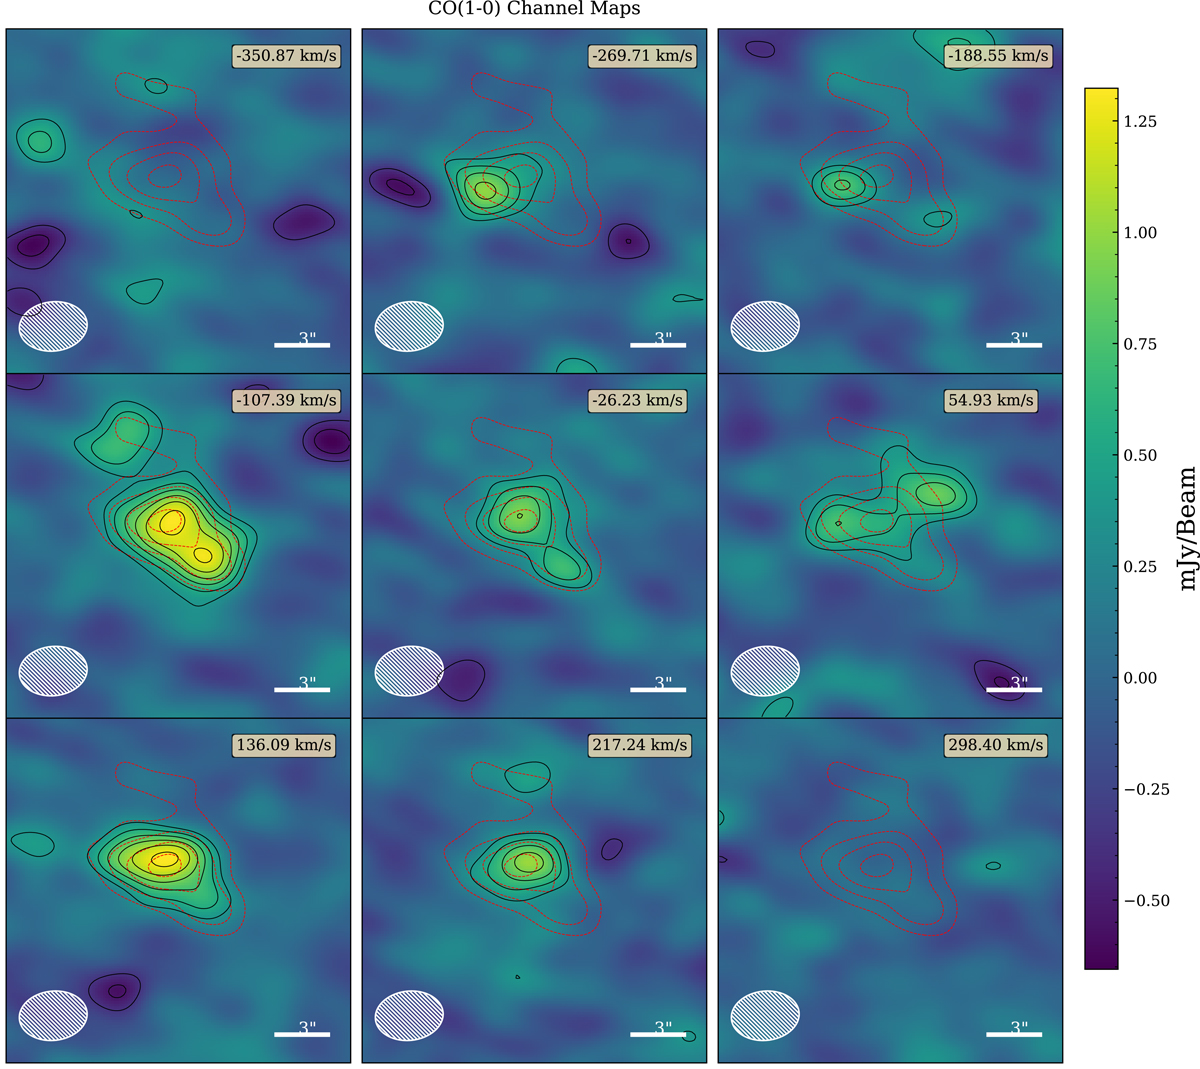
Channel maps binned 80 km s−1 determined relative to the redshifted CO(1-0) transition assuming a redshift of z = 0.1555, consistent with that determined for the BCG in Donahue et al. (2010). The red contours correspond to the ≥2σ contours in the CO(1-0) moment = 0 map shown in the upper panel of Figure 4. The solid black contours correspond to the signal in each maps and start at 2σ significance. The channel maps were used to inform the region choices in Fig. 14.
Current usage metrics show cumulative count of Article Views (full-text article views including HTML views, PDF and ePub downloads, according to the available data) and Abstracts Views on Vision4Press platform.
Data correspond to usage on the plateform after 2015. The current usage metrics is available 48-96 hours after online publication and is updated daily on week days.
Initial download of the metrics may take a while.