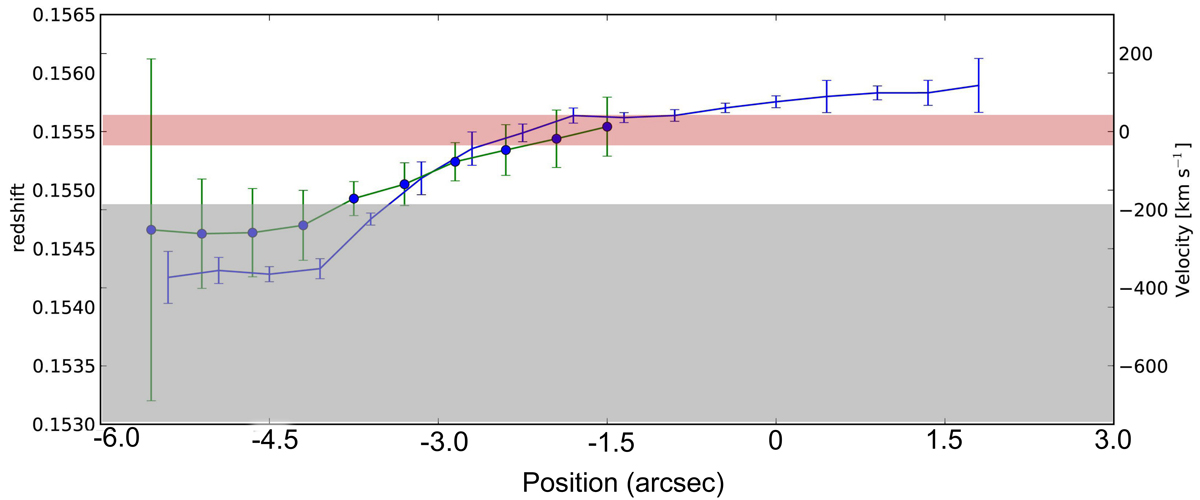
Fig. 12.
Download original image
Redshifts and equivalent line of sight velocities with respect to z = 0.1555. The data points indicated by blue circles with green error bars are averages from Hβ, [OIII] 5007, [NI] 5199, [OI] 6300. The blue line is the average from Hα and [NII] 6548. The grey band marks the 90% confidence range for the Chandra redshift fit. The narrow red band marks the cross correlation centre for the stellar absorption spectra. Angular distances in arcseconds are relative to the centre of the BCG, taken along position angle of 110°, running west to east (i.e. more positive with increasing RA).
Current usage metrics show cumulative count of Article Views (full-text article views including HTML views, PDF and ePub downloads, according to the available data) and Abstracts Views on Vision4Press platform.
Data correspond to usage on the plateform after 2015. The current usage metrics is available 48-96 hours after online publication and is updated daily on week days.
Initial download of the metrics may take a while.