Fig. 1.
Download original image
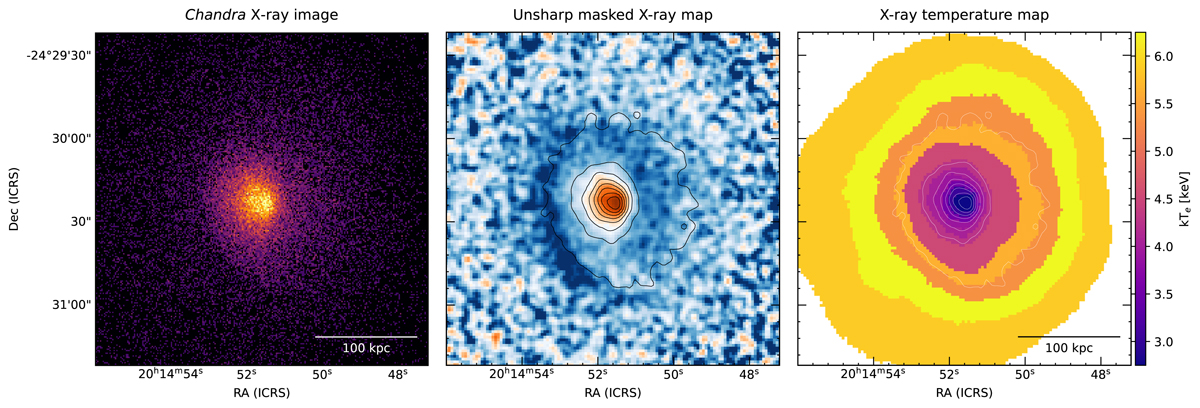
Chandra X-ray imaging and derived temperature of RXC J2014.8−2430. Left: broadband Chandra X-ray image of RXC J2014.8−2430 in the 0.5−7.0 keV range, shown on a square root scale, roughly following projected density. We note that no point sources were removed from the image. Right is west, and north is up. Middle: unsharp masked Chandra X-ray surface brightness shown on a logarithmic scale, with X-ray contours from the left panel. The image was produced to highlight surface brightness edges. The image reveals a spiral decrement characteristic of cold fronts induced by sloshing, running anticlockwise from the western portion of the core outwards. Right: temperature map derived by applying the contour binning technique of Sanders (2006) to the Chandra X-ray data for the core region of RXC J2014.8−2430. Contours are from the left panel.
Current usage metrics show cumulative count of Article Views (full-text article views including HTML views, PDF and ePub downloads, according to the available data) and Abstracts Views on Vision4Press platform.
Data correspond to usage on the plateform after 2015. The current usage metrics is available 48-96 hours after online publication and is updated daily on week days.
Initial download of the metrics may take a while.