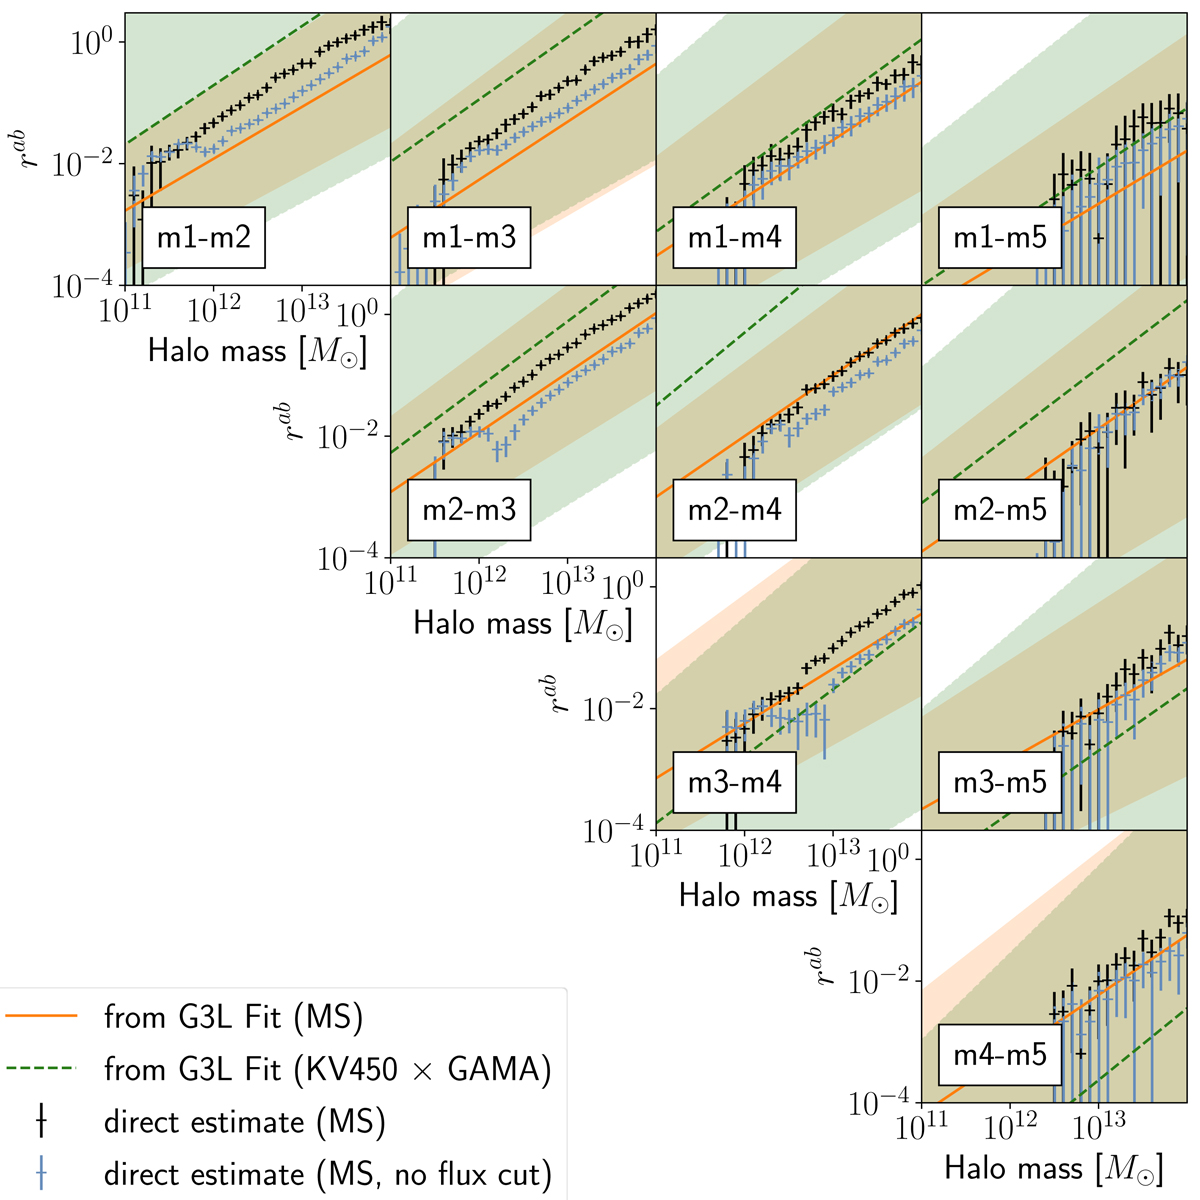
Fig. 13.
Download original image
Correlation parameter rab for stellar mass-selected galaxies in the MS and in KV450×GAMA. Black crosses show the true correlation for the MS, where the error bars are the standard deviation of the mean over the 64 simulated line-of-sights. The solid brown line shows rab inferred from a simulated G3L analysis of MS, and the green dashed line the inference for KV450×GAMA. The shaded areas show the 68% credibility bands of the inferences. Blue points show the correlation parameter of galaxies in the MS selected without assuming a flux limit.
Current usage metrics show cumulative count of Article Views (full-text article views including HTML views, PDF and ePub downloads, according to the available data) and Abstracts Views on Vision4Press platform.
Data correspond to usage on the plateform after 2015. The current usage metrics is available 48-96 hours after online publication and is updated daily on week days.
Initial download of the metrics may take a while.