Fig. 12.
Download original image
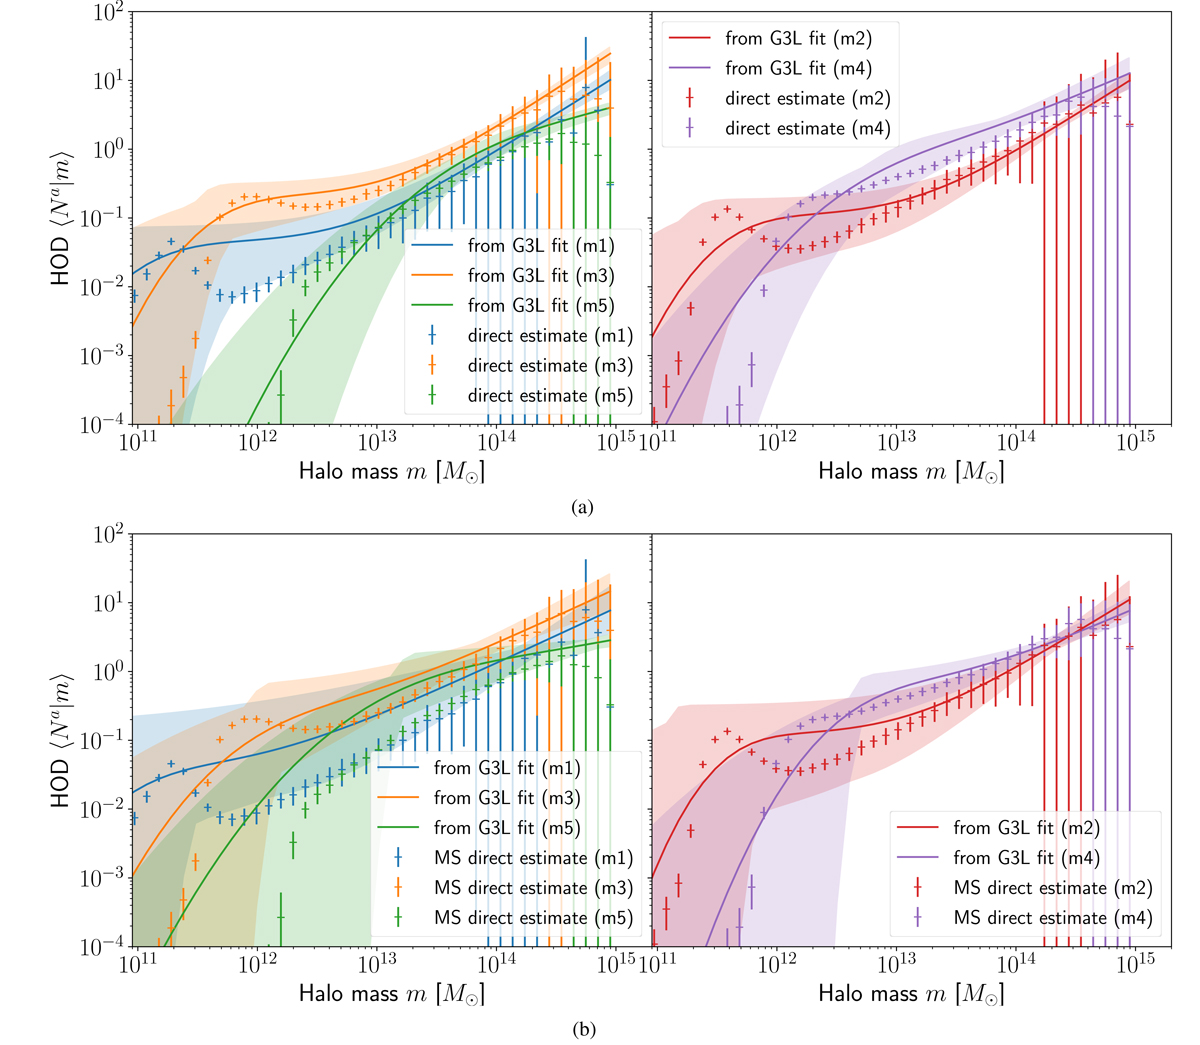
Mean per-halo galaxy numbers in the simulation (top) and observation (bottom) for lens galaxies from each stellar mass bin as function of halo mass. Crosses indicate the directly estimated per-halo numbers of simulated galaxies, while lines show the predictions from the G3L fits. The shaded areas indicate the 68% confidence areas. Left panels: the mean per-halo numbers for galaxies from stellar mass bins m1, m3, and m5 obtained from the fits to the G3L signal for m1–m5, m3–m5, and m4–m5. The right panels show the same for galaxies from stellar mass bins m2 and m5, obtained from the fits to the signal for m2–m5 and m4–m5. The corresponding HOD parameters are listed in Table C.1. (a) MS. (b) KV450 × GAMA.
Current usage metrics show cumulative count of Article Views (full-text article views including HTML views, PDF and ePub downloads, according to the available data) and Abstracts Views on Vision4Press platform.
Data correspond to usage on the plateform after 2015. The current usage metrics is available 48-96 hours after online publication and is updated daily on week days.
Initial download of the metrics may take a while.