Open Access
Fig. 11.
Download original image
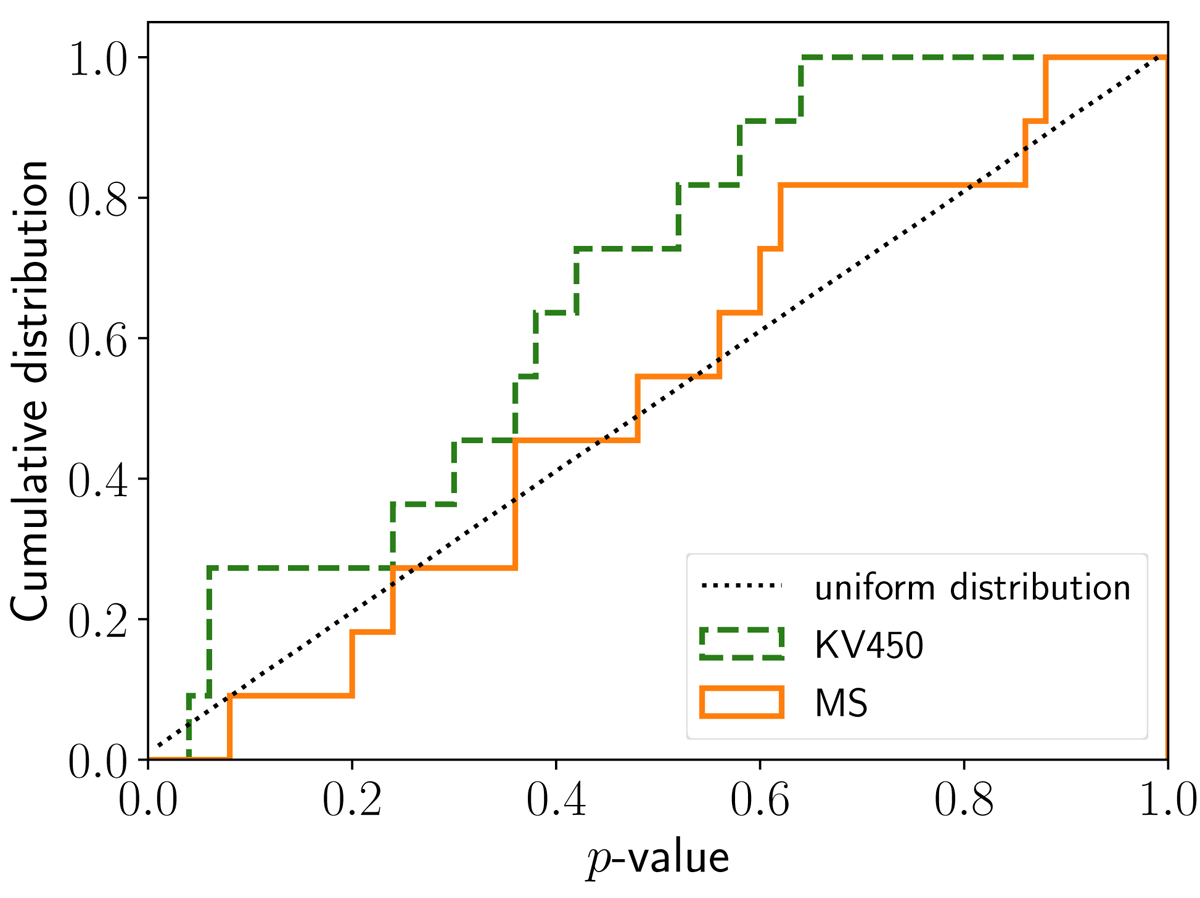
Cumulative distribution of p-values of G3L halo model fits for MS (orange, solid) and KV450 × GAMA (green, dashed). For a perfect description of G3L signal and data noise, the distributions would be consistent with a uniform distribution (black, dotted).
Current usage metrics show cumulative count of Article Views (full-text article views including HTML views, PDF and ePub downloads, according to the available data) and Abstracts Views on Vision4Press platform.
Data correspond to usage on the plateform after 2015. The current usage metrics is available 48-96 hours after online publication and is updated daily on week days.
Initial download of the metrics may take a while.