Fig. 8
Download original image
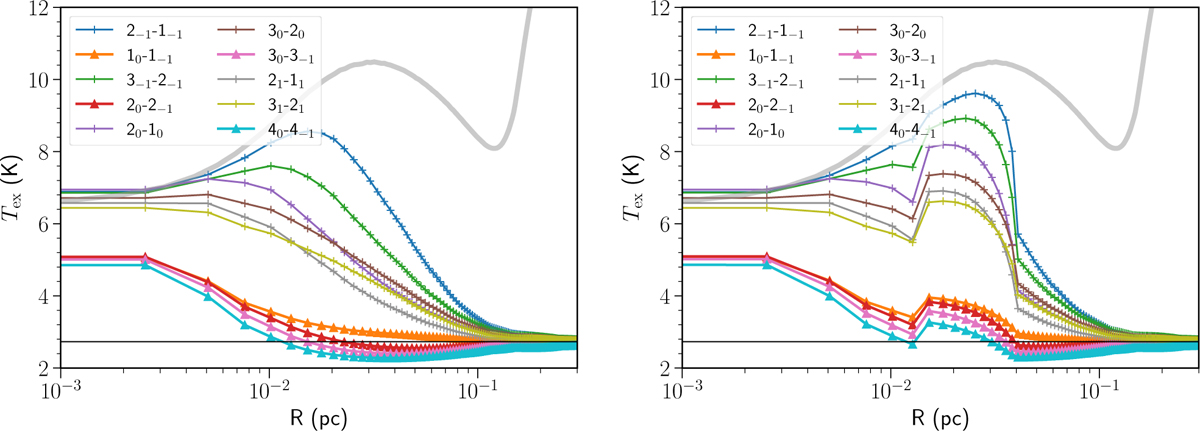
Comparison between T(r) (gray line) and the radial profile of Tex of all CH3OH lines from the best-fit model with modified radial density profiles (left) and original density profiles (right). The best-fit abundance profiles are at 0.8 Myr from Vasyunin et al. (2017), which were scaled down by a factor of 5 and 10 in the left and right panels (of model A and model B), respectively. The cosmic microwave background temperature of 2.73 Κ is also indicated (black horizontal line). The four J0−J−1 lines are shown with thicker line widths.
Current usage metrics show cumulative count of Article Views (full-text article views including HTML views, PDF and ePub downloads, according to the available data) and Abstracts Views on Vision4Press platform.
Data correspond to usage on the plateform after 2015. The current usage metrics is available 48-96 hours after online publication and is updated daily on week days.
Initial download of the metrics may take a while.