Fig. 5
Download original image
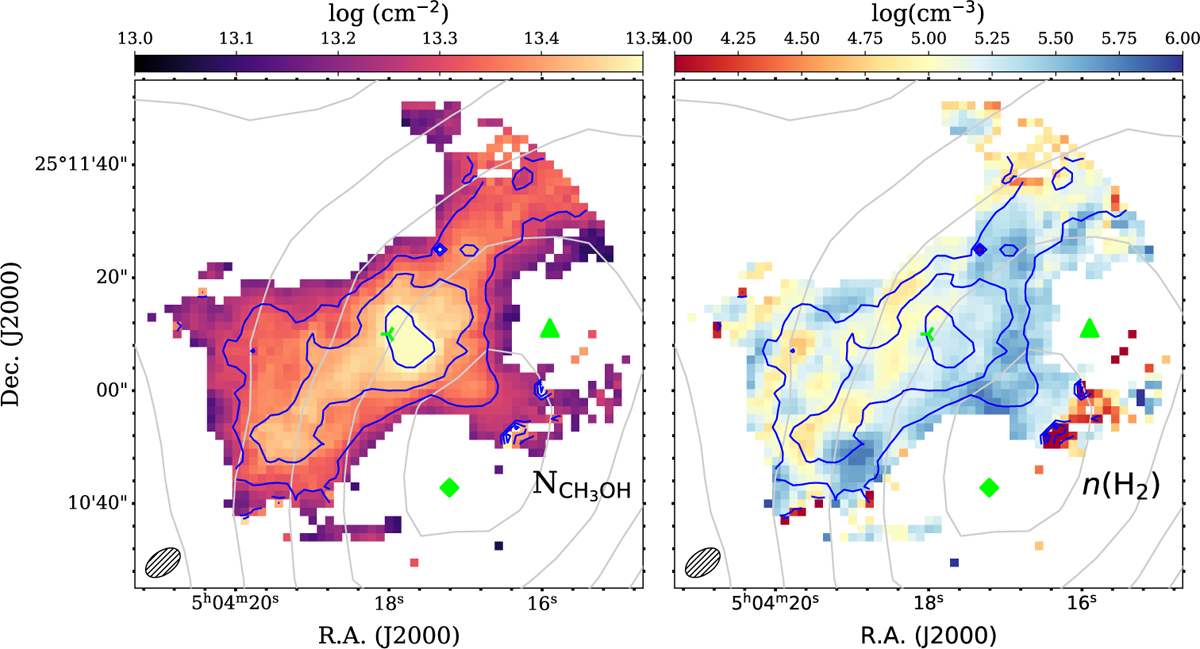
![]() and n(Η2) maps at the CH3OH peak (data from Punanova et al. 2018). The blue contour levels correspond to
and n(Η2) maps at the CH3OH peak (data from Punanova et al. 2018). The blue contour levels correspond to ![]() values of 2.0 × 10¹³, 2.5 ×10¹³, and 3.2 × 1013cm−2. The gray contours show the Ν(H2) contours of 1.0 ×10²², 1.2 ×10²², 1.6 ×10²², 2.0 × 10²², and 2.5 × 1022 cm−2 from the spectral energy distribution fitting of Herschel data (Spezzano et al. 2016). The dust peak, the CH3OH peak, and the HNCO peak are indicated as a green diamond, a three-branched triangle, and an upward pointing triangle, respectively.
values of 2.0 × 10¹³, 2.5 ×10¹³, and 3.2 × 1013cm−2. The gray contours show the Ν(H2) contours of 1.0 ×10²², 1.2 ×10²², 1.6 ×10²², 2.0 × 10²², and 2.5 × 1022 cm−2 from the spectral energy distribution fitting of Herschel data (Spezzano et al. 2016). The dust peak, the CH3OH peak, and the HNCO peak are indicated as a green diamond, a three-branched triangle, and an upward pointing triangle, respectively.
Current usage metrics show cumulative count of Article Views (full-text article views including HTML views, PDF and ePub downloads, according to the available data) and Abstracts Views on Vision4Press platform.
Data correspond to usage on the plateform after 2015. The current usage metrics is available 48-96 hours after online publication and is updated daily on week days.
Initial download of the metrics may take a while.