Open Access
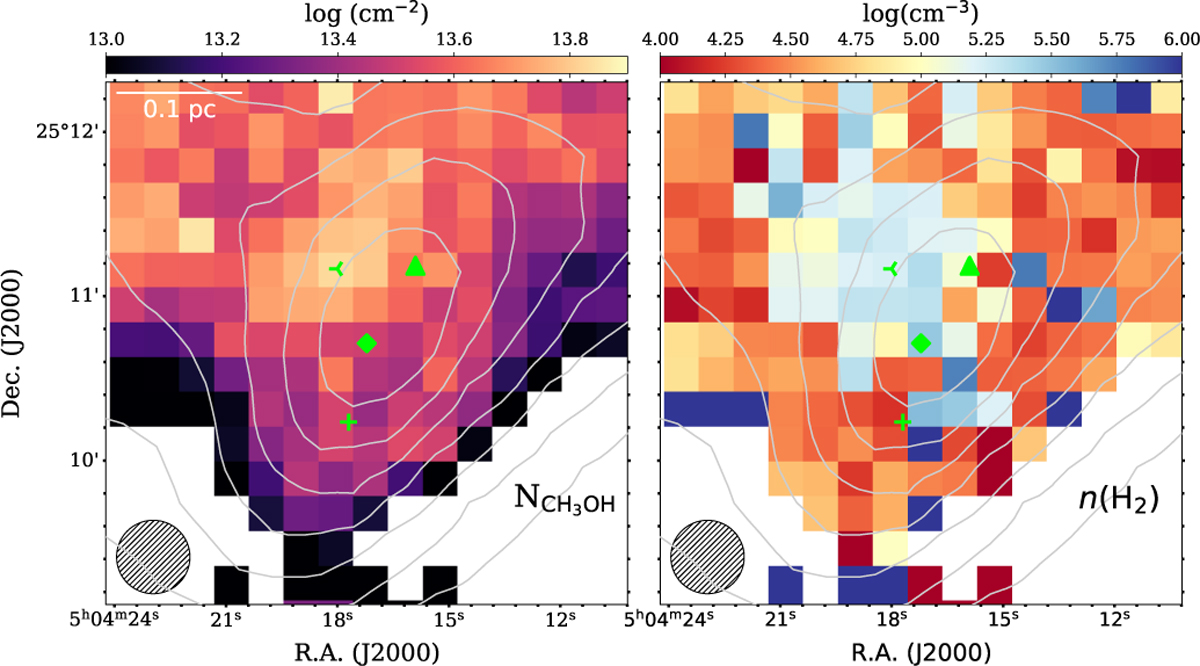
Fig. 4
Download original image
Derived CH3OH column density map and hydrogen volume density from RADEX modeling. The contours (in gray) are NH2 levels, the same as those in Fig. 1. The markers in blue represent the dust peak (diamond), molecular emission peaks of CH3OH (three-branched triangle), HNCO (upward pointing triangle), and c-C3H2 (plus sign).
Current usage metrics show cumulative count of Article Views (full-text article views including HTML views, PDF and ePub downloads, according to the available data) and Abstracts Views on Vision4Press platform.
Data correspond to usage on the plateform after 2015. The current usage metrics is available 48-96 hours after online publication and is updated daily on week days.
Initial download of the metrics may take a while.