Fig. B.4
Download original image
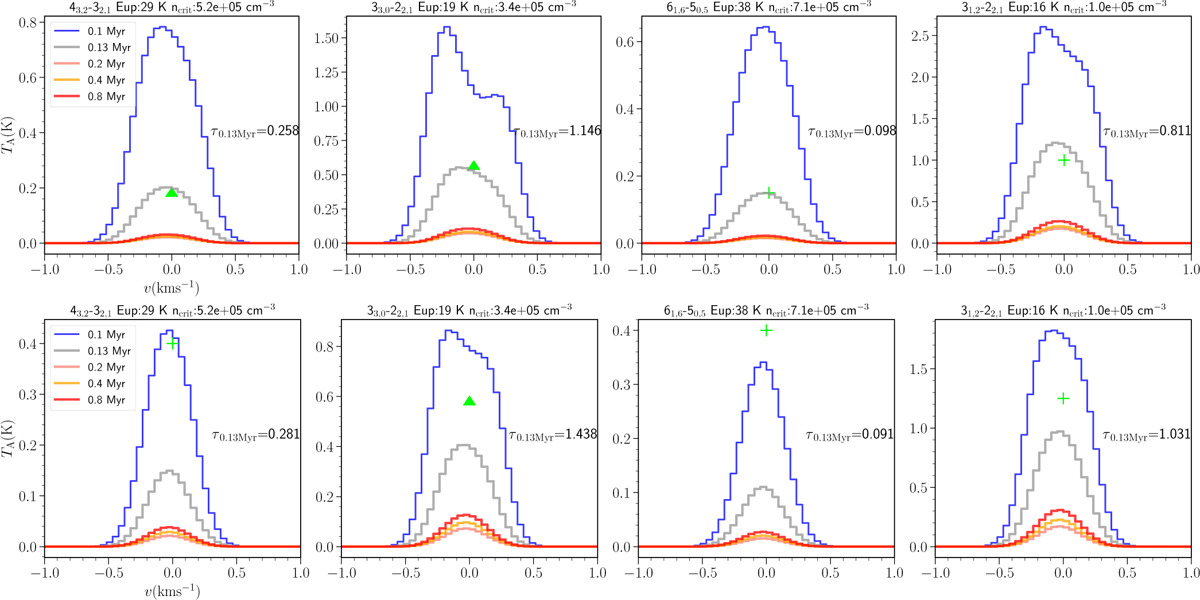
Comparison between modeled spectra and observed c-C3H2 lines, with radial abundance profiles following Sipilä et al. (2015) for different epochs between 0.1 and 1 Myr. The spectra at the dust peak and at the c-C3H2 peak are shown in the upper panel and lower panels, respectively. The optical depth for each modeled line of the 0.13 Myr epoch abundance profile is indicated in each subplot.
Current usage metrics show cumulative count of Article Views (full-text article views including HTML views, PDF and ePub downloads, according to the available data) and Abstracts Views on Vision4Press platform.
Data correspond to usage on the plateform after 2015. The current usage metrics is available 48-96 hours after online publication and is updated daily on week days.
Initial download of the metrics may take a while.