Open Access
Fig. A.3
Download original image
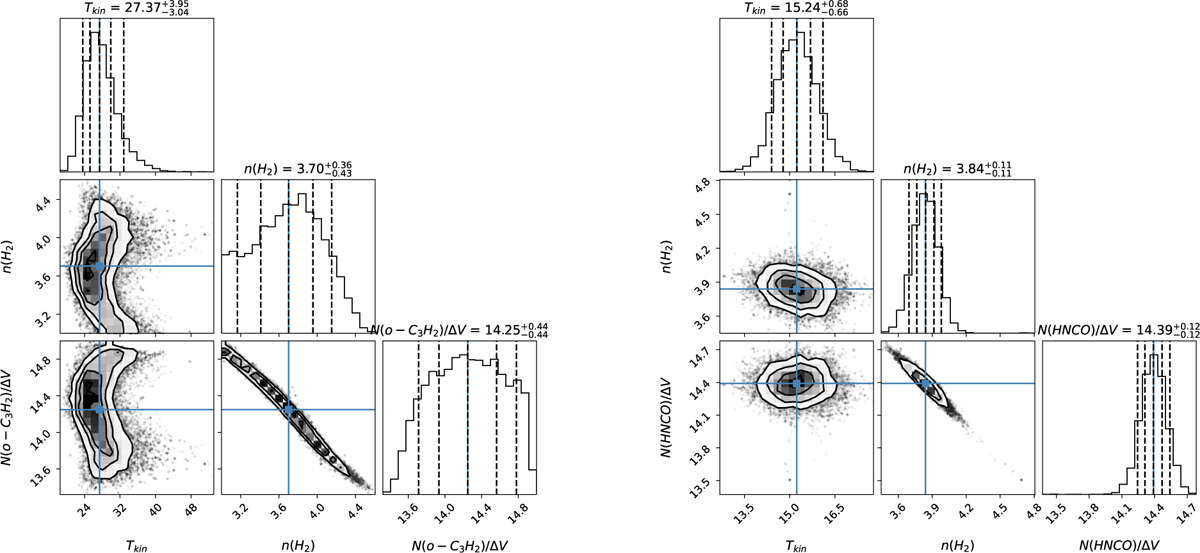
Posterior distribution of Tkin, log10(n(Η2)), and log10(Nmol/ΔV) based on modeling c-C3H2 lines at the o-C3H2 peak. Left: All parameters kept free. Right: Tkin following N(μ=10 Κ, σ =5 Κ) with the other two parameters kept free.
Current usage metrics show cumulative count of Article Views (full-text article views including HTML views, PDF and ePub downloads, according to the available data) and Abstracts Views on Vision4Press platform.
Data correspond to usage on the plateform after 2015. The current usage metrics is available 48-96 hours after online publication and is updated daily on week days.
Initial download of the metrics may take a while.