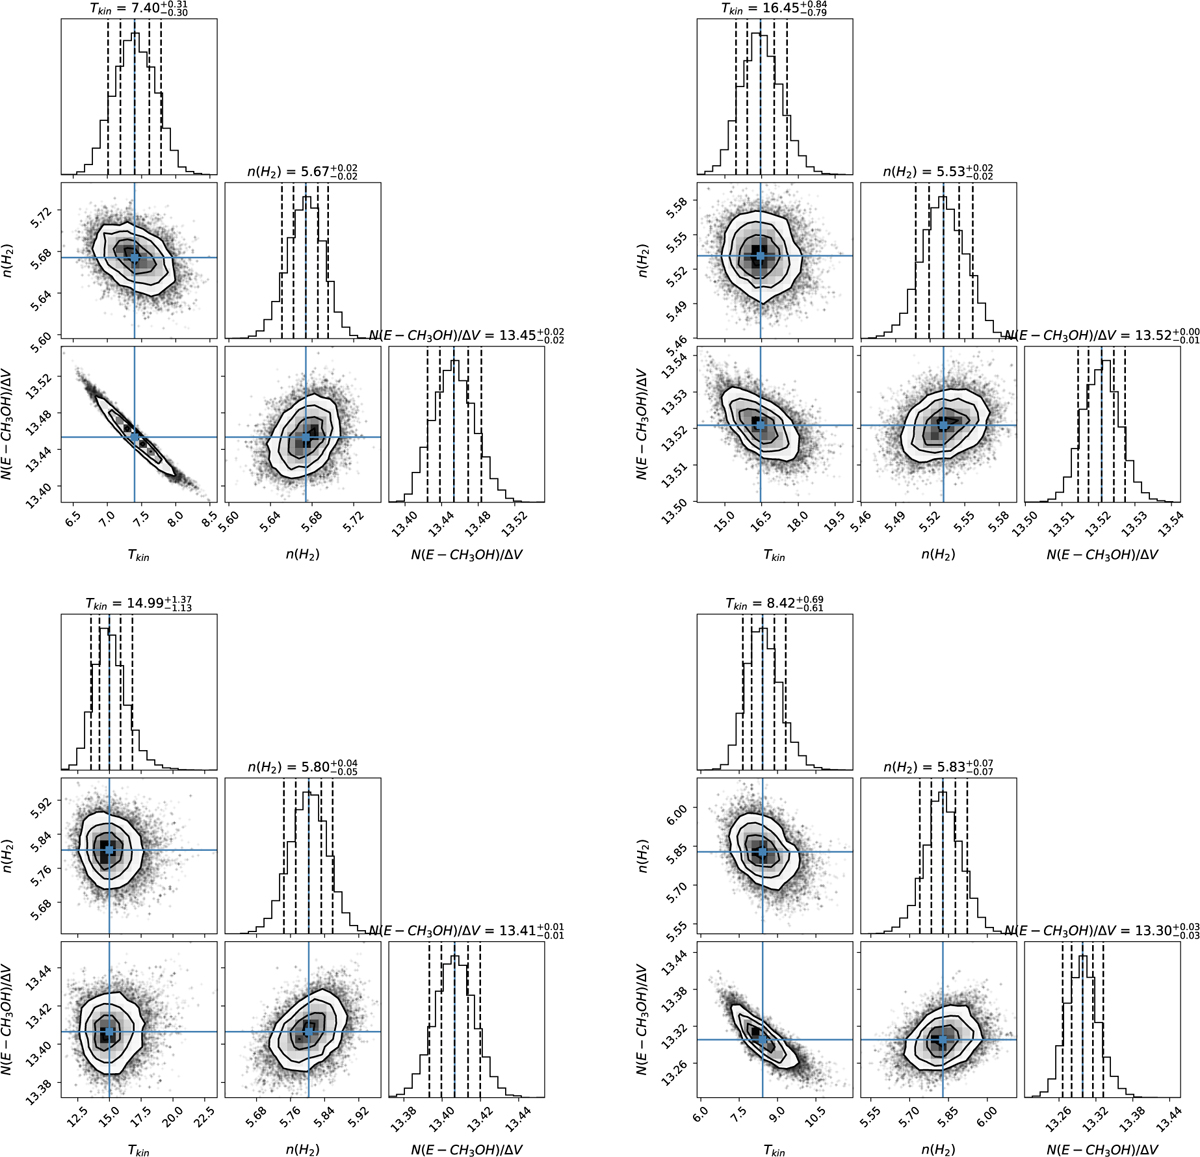
Fig. A.1
Download original image
Posterior distribution of parameters Tkin, lοg10(n(Η2)), and log10(Nmol/ΔV) based on modeling CH3OH (E-tyρe) lines at the dust peak (upper left), the CH3OH peak (upper right), the HNCO peak (lower left), and the c-C3H2 peak (lower right). All three parameters are kept free. In these plots and the plots in Figs. A.2–A.4, the vertical dashed lines in the one-dimensional histograms show the quantiles of 10%, 25%, 50%, 75%, and 90%. The contour levels in the two-dimensional histograms indicate Ο.5σ 1σ 1.5σ and 2σ respectively.
Current usage metrics show cumulative count of Article Views (full-text article views including HTML views, PDF and ePub downloads, according to the available data) and Abstracts Views on Vision4Press platform.
Data correspond to usage on the plateform after 2015. The current usage metrics is available 48-96 hours after online publication and is updated daily on week days.
Initial download of the metrics may take a while.