Fig. 10
Download original image
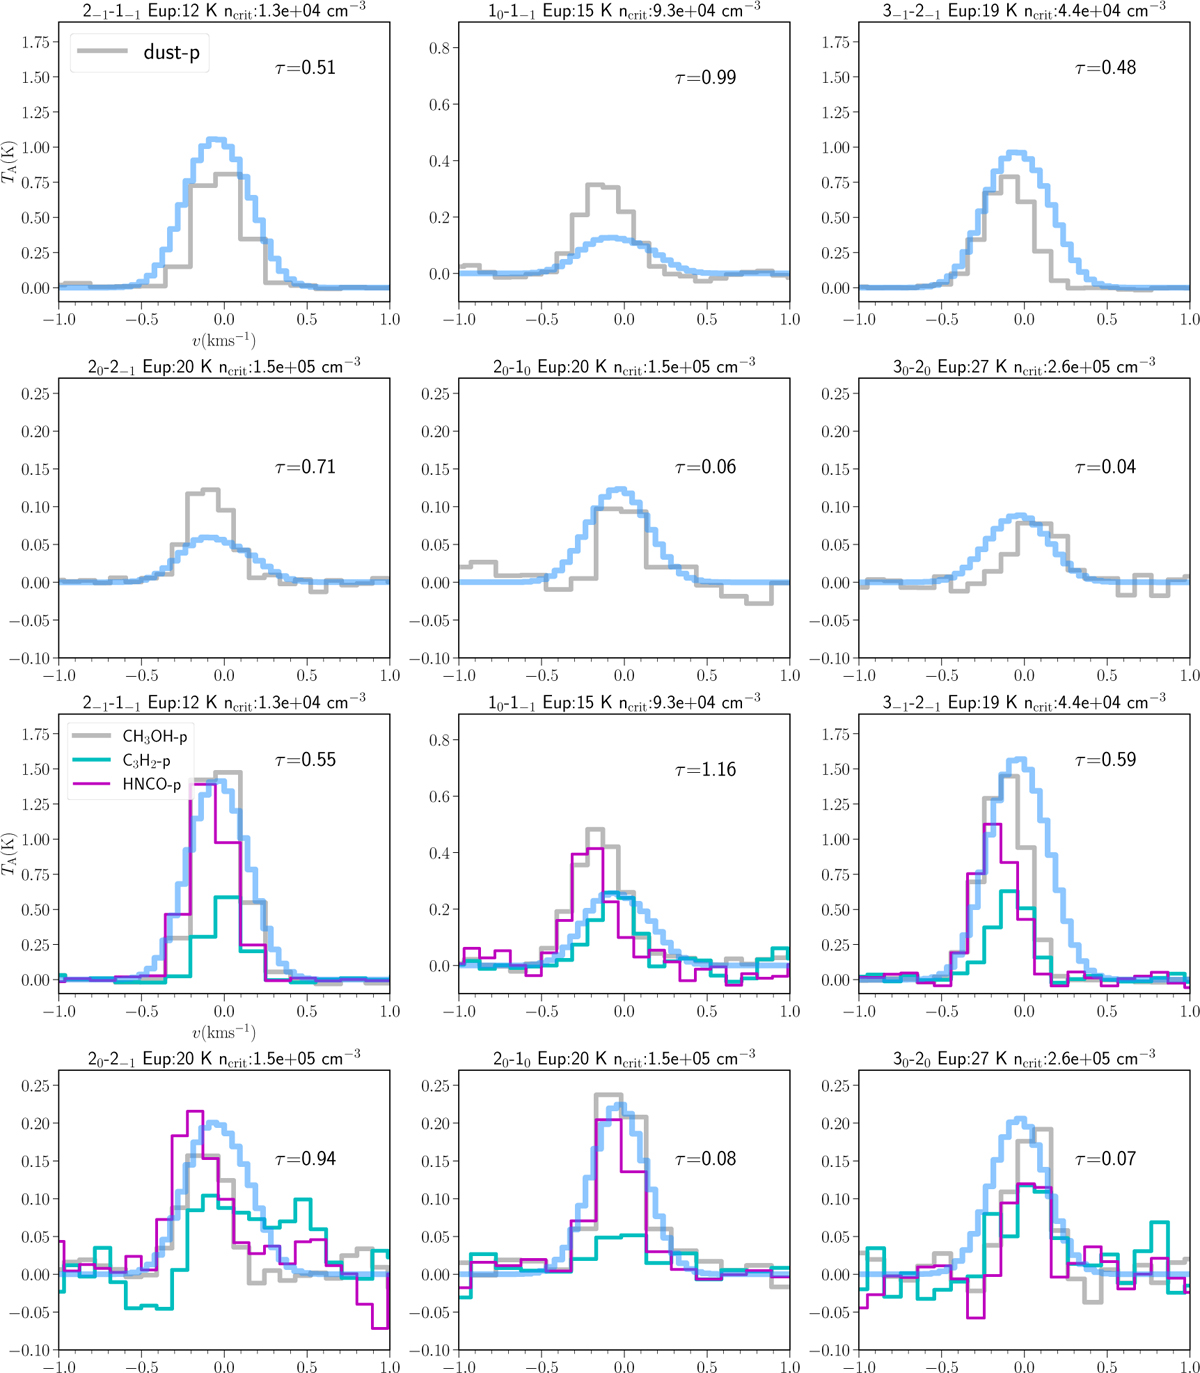
Comparison between the best-fit modeled spectra (in blue lines) and observed CH3OH lines (gray histograms) at the dust peak (upper two rows) and CH3OH peak (lower two rows). In the lowest panels, the spectra at the c-C3Hշ peak and HNCO peak are also shown for comparison. The optical depth at the line center derived from the model is indicated in each subplot.
Current usage metrics show cumulative count of Article Views (full-text article views including HTML views, PDF and ePub downloads, according to the available data) and Abstracts Views on Vision4Press platform.
Data correspond to usage on the plateform after 2015. The current usage metrics is available 48-96 hours after online publication and is updated daily on week days.
Initial download of the metrics may take a while.