Fig. 1
Download original image
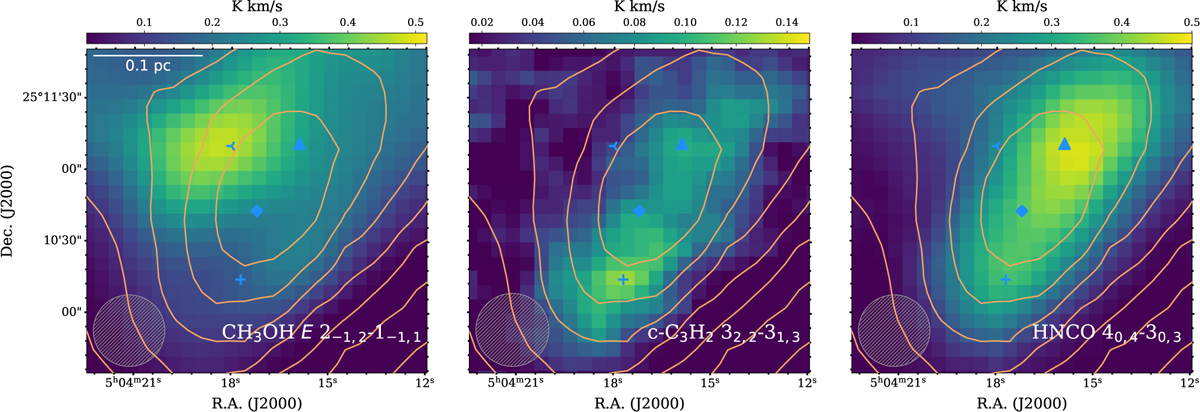
Integrated intensity maps (in color scale) of CH3OH-E 2−1,2−1−1,1, c-C3H2 З2,2−31,3, and HNCO 40,4−30,з (from left to right) observed by the IRAM 30 m telescope, showing the different locations of the molecular peaks (Table 2, Spezzano et al. 2017). The contour levels (in orange) show 3.2 × 10²¹, 4.3 × 10²¹, 5.9 × 10²¹, 8.1 × 10²¹, 1.1 × 10²², 1.5 × 10²², and 2.1 × 1022 cm−2 of the molecular hydrogen column density (![]() ) map (Spezzano et al. 2016). The markers in blue represent the dust peak (diamond), molecular emission peaks of CH3OH (three-branched triangle), HNCO (upward pointing triangle), and c-C3Η2 (plus sign).
) map (Spezzano et al. 2016). The markers in blue represent the dust peak (diamond), molecular emission peaks of CH3OH (three-branched triangle), HNCO (upward pointing triangle), and c-C3Η2 (plus sign).
Current usage metrics show cumulative count of Article Views (full-text article views including HTML views, PDF and ePub downloads, according to the available data) and Abstracts Views on Vision4Press platform.
Data correspond to usage on the plateform after 2015. The current usage metrics is available 48-96 hours after online publication and is updated daily on week days.
Initial download of the metrics may take a while.