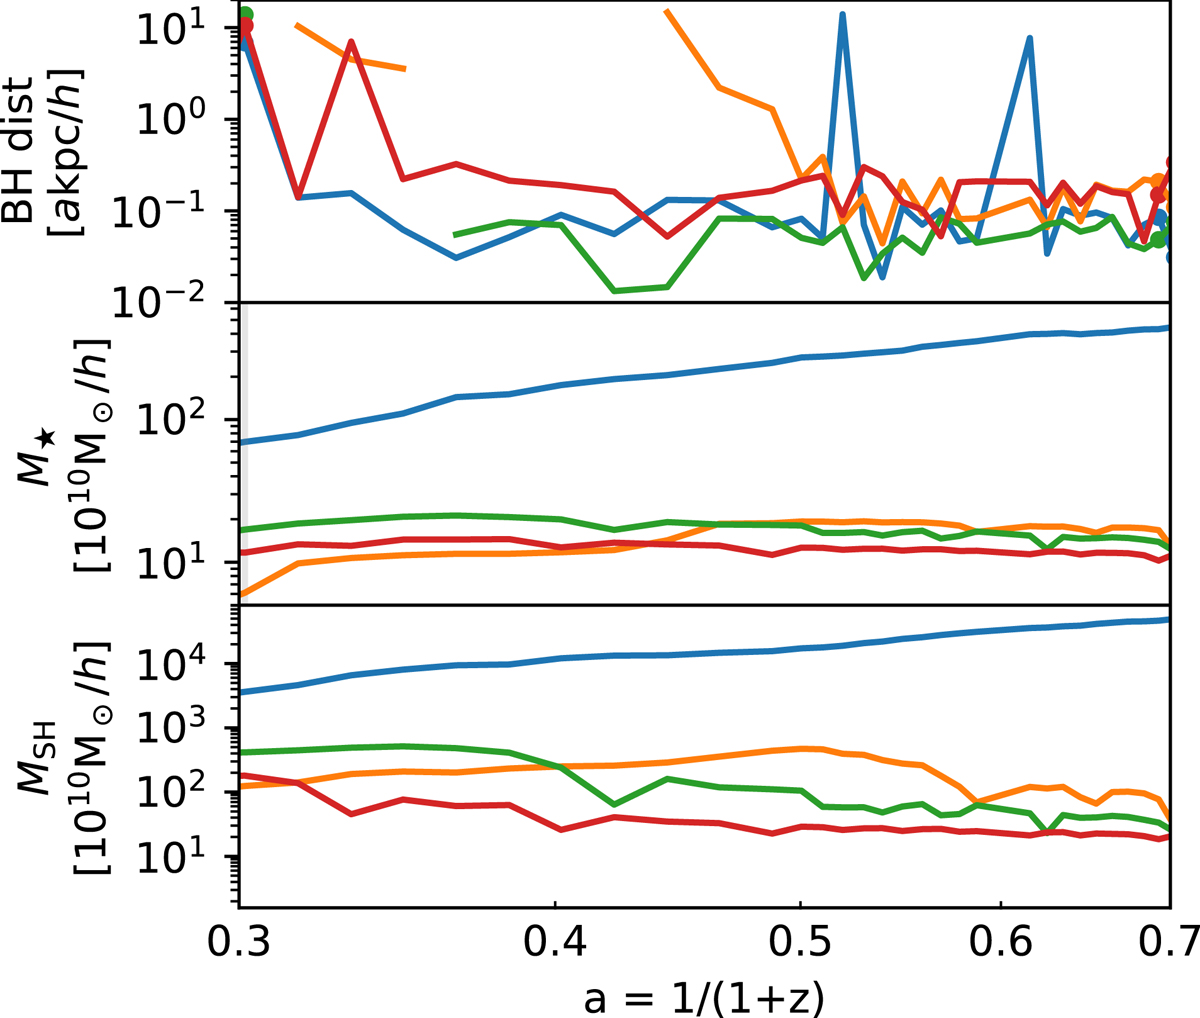
Fig. 9.
Download original image
Four most massive central SHs of D6 10 × B20. Upper panel shows the distance from the nearest most massive black hole within 20 akpc h−1, central panel shows the evolution of the stellar mass and bottom panel shows the evolution of the total SH mass. Each colour represents a different SH. The blue upper line is relative to the BCG.
Current usage metrics show cumulative count of Article Views (full-text article views including HTML views, PDF and ePub downloads, according to the available data) and Abstracts Views on Vision4Press platform.
Data correspond to usage on the plateform after 2015. The current usage metrics is available 48-96 hours after online publication and is updated daily on week days.
Initial download of the metrics may take a while.