Fig. 8.
Download original image
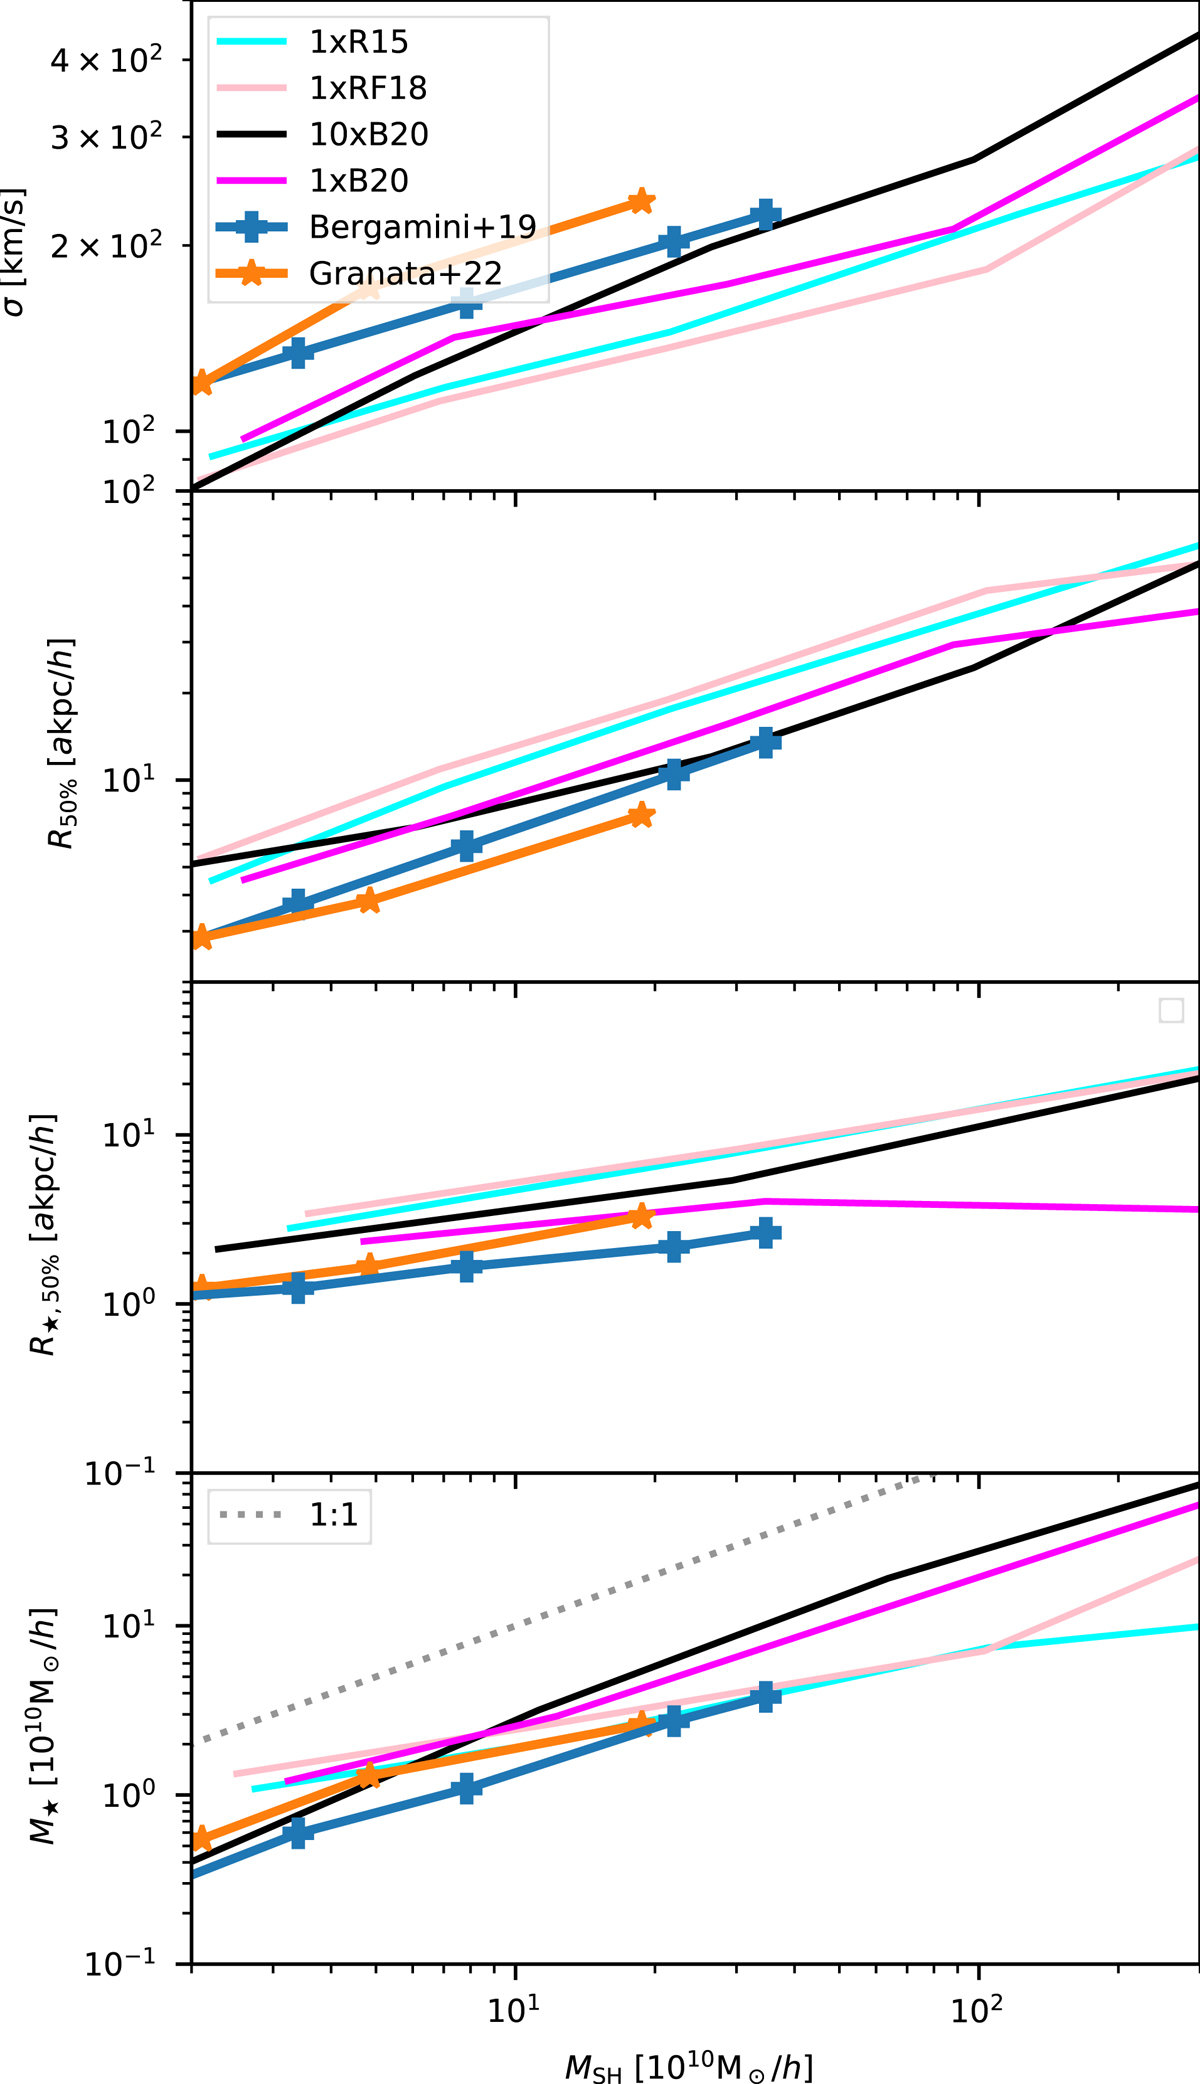
Median velocity dispersion ![]() (top panel), median half total mass radius R50% (second panel), median half stellar mass projected radius R⋆, 50% (third panel), and median total stellar mass M⋆ (fourth and last panels), all vs. MSH. In this plot, we exclude central SHs. Simulation suites are coloured as in Fig. 2. We also show median values of observations from cluster AS1063 presented in Bergamini et al. (2019) (blue solid lines with crosses) and Granata et al. (2022) (orange solid lines with diamonds). We also show Granata et al. (2022) radii (third panel) and stellar masses (fourth panel) over SH masses from Bergamini et al. (2019) via blue lines. Low-mass simulated SHs have stellar masses in agreement with observations, but they are too large, while high-mass simulated SHs are too numerous (no observations for SHs with MSH > 4 × 10¹¹ h−1 M⊙).
(top panel), median half total mass radius R50% (second panel), median half stellar mass projected radius R⋆, 50% (third panel), and median total stellar mass M⋆ (fourth and last panels), all vs. MSH. In this plot, we exclude central SHs. Simulation suites are coloured as in Fig. 2. We also show median values of observations from cluster AS1063 presented in Bergamini et al. (2019) (blue solid lines with crosses) and Granata et al. (2022) (orange solid lines with diamonds). We also show Granata et al. (2022) radii (third panel) and stellar masses (fourth panel) over SH masses from Bergamini et al. (2019) via blue lines. Low-mass simulated SHs have stellar masses in agreement with observations, but they are too large, while high-mass simulated SHs are too numerous (no observations for SHs with MSH > 4 × 10¹¹ h−1 M⊙).
Current usage metrics show cumulative count of Article Views (full-text article views including HTML views, PDF and ePub downloads, according to the available data) and Abstracts Views on Vision4Press platform.
Data correspond to usage on the plateform after 2015. The current usage metrics is available 48-96 hours after online publication and is updated daily on week days.
Initial download of the metrics may take a while.