Fig. 4.
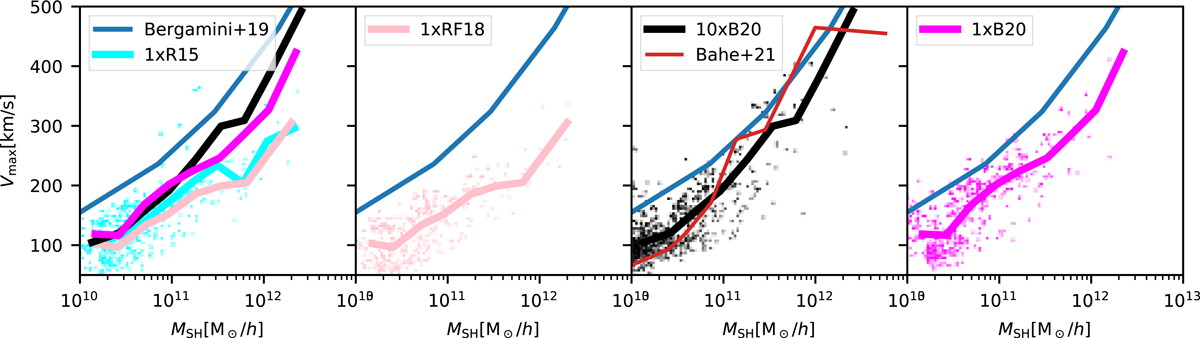
Download original image
Vmax vs. SH mass for 10 × B20 simulations (left panel), 1 × R15 (central panel), and 1 × RF18 (right panel), for all SHs (except for BCGs) with a projected distance (R < 0.15Rvir). The cyan, pink, black, and magenta lines refer to the 1 × R15, 1 × RF18, 10 × B20, and 1 × B20 simulations, respectively. The relation from Bergamini et al. (2019) is over-plotted in blue. We report data for 10 × B20 simulations (black solid line), a 1 × R15 simulation subset of 10 × B20 regions (solid cyan line), a 1 × RF18 simulation subset of 10 × B20 regions (pink line), and 1xfSH (magenta line), for SHs with projected distances < 0.15Rvir (right panel). We compare our high-resolution simulations with simulated data points of high-resolution Hydrangea simulations (Bahé et al. 2022) (red).
Current usage metrics show cumulative count of Article Views (full-text article views including HTML views, PDF and ePub downloads, according to the available data) and Abstracts Views on Vision4Press platform.
Data correspond to usage on the plateform after 2015. The current usage metrics is available 48-96 hours after online publication and is updated daily on week days.
Initial download of the metrics may take a while.