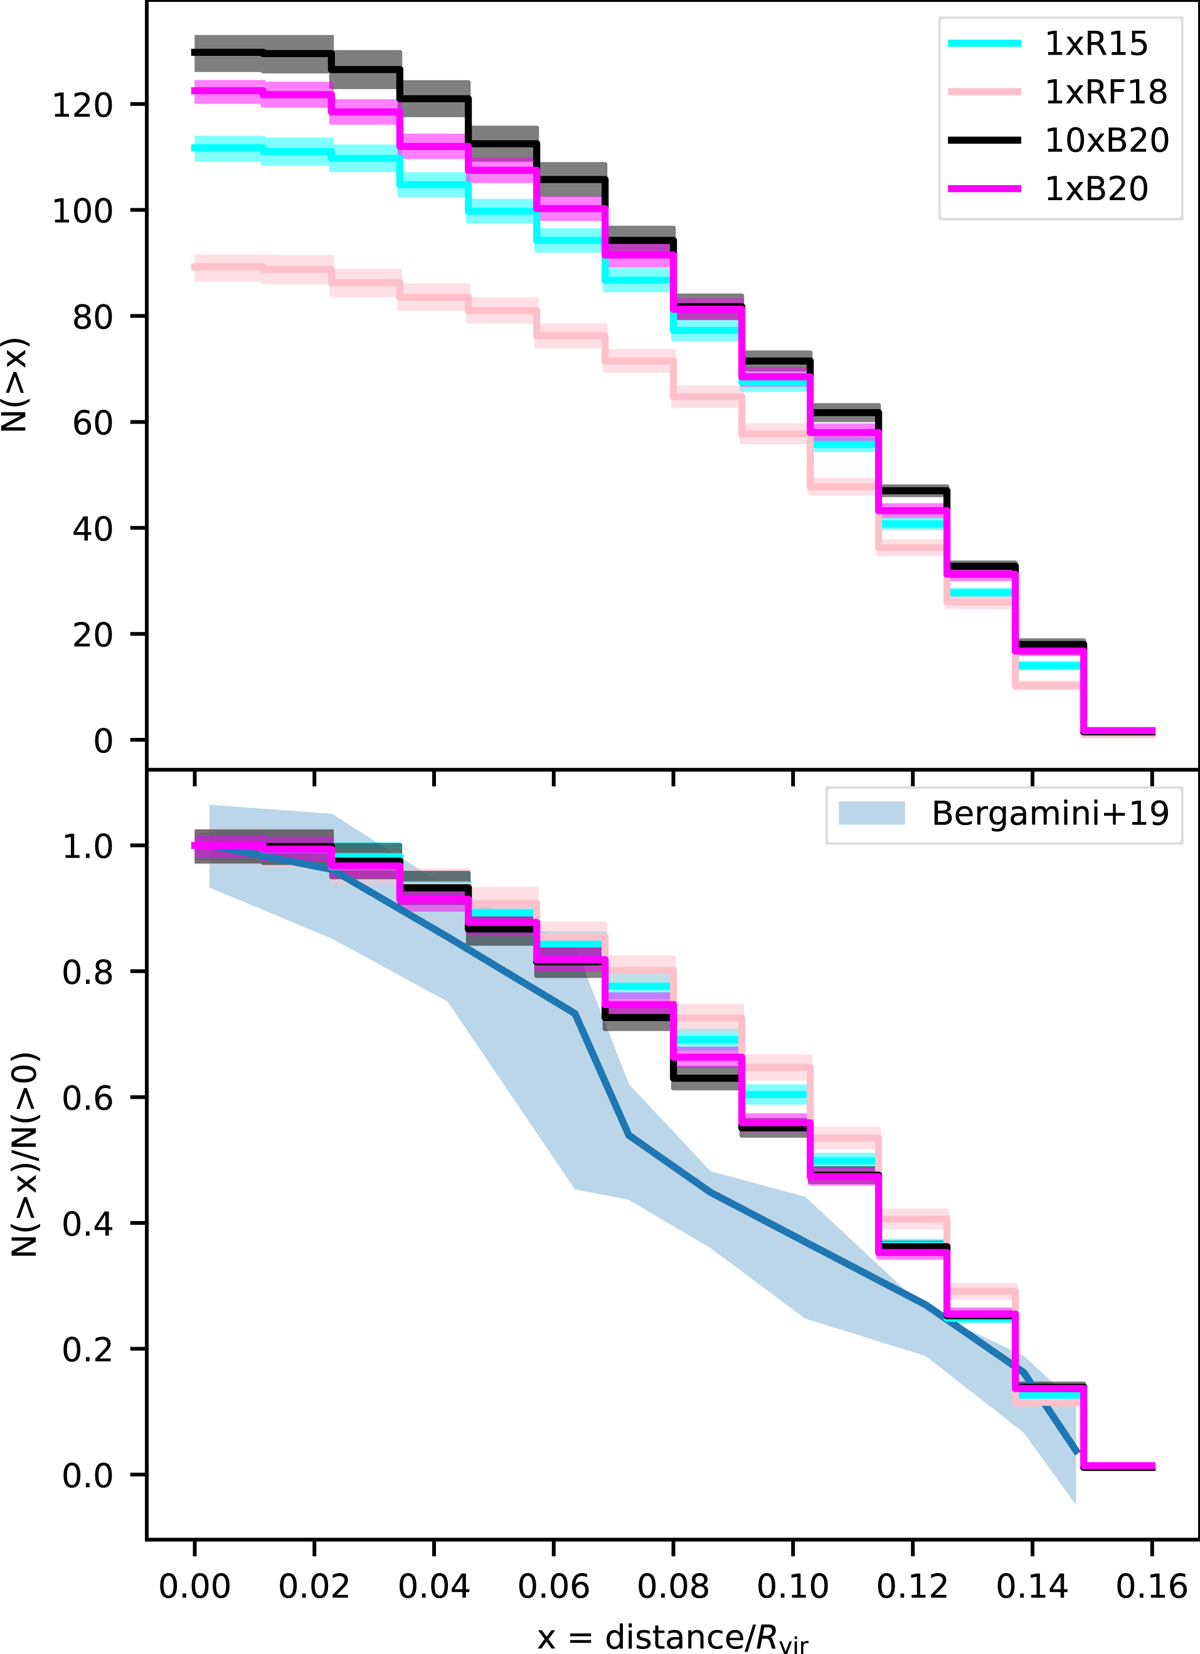
Fig. 3.
Download original image
Average cumulative number of SHs (top panel) and the same value normalised to unity (bottom panel) within a given projected cluster-centric distance in units of the host virial radius. Here, we only consider the four Dianoga regions in common between all four setups in Table 2, and SHs within a projected distance of R < 0.15Rvir and a total mass greater than 2 × 10¹⁰ h−1 M⊙. The black, cyan, and pink lines refer to the 10×, 1 × R15, and 1 × RF18 simulations, respectively. Shaded area shows data from Bergamini et al. (2019).
Current usage metrics show cumulative count of Article Views (full-text article views including HTML views, PDF and ePub downloads, according to the available data) and Abstracts Views on Vision4Press platform.
Data correspond to usage on the plateform after 2015. The current usage metrics is available 48-96 hours after online publication and is updated daily on week days.
Initial download of the metrics may take a while.